1826 S Main St Dayton, OH 45409
University Park NeighborhoodEstimated Value: $430,000 - $587,000
5
Beds
2
Baths
3,200
Sq Ft
$159/Sq Ft
Est. Value
About This Home
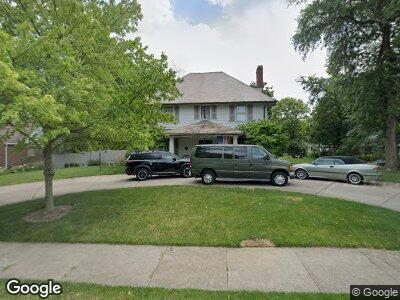
This home is located at 1826 S Main St, Dayton, OH 45409 and is currently estimated at $510,060, approximately $159 per square foot. 1826 S Main St is a home located in Montgomery County with nearby schools including Horace Mann Elementary School, Cleveland Elementary School, and Eastmont Elementary.
Ownership History
Date
Name
Owned For
Owner Type
Purchase Details
Closed on
Feb 7, 2025
Sold by
Slaybaugh Terrence and Slaybaugh Donna
Bought by
Terrence And Donna Slaybaugh Revocable Living and Slaybaugh
Current Estimated Value
Purchase Details
Closed on
Jun 20, 2018
Sold by
Slaybaugh Terrence and Slaybaugh Donna
Bought by
Slaybaugh Terrence and Slaybaugh Donna
Home Financials for this Owner
Home Financials are based on the most recent Mortgage that was taken out on this home.
Original Mortgage
$25,000
Interest Rate
4.5%
Mortgage Type
Purchase Money Mortgage
Purchase Details
Closed on
Nov 15, 2011
Sold by
Kelley Alan and Kelley Linda
Bought by
Slaybaugh Terrence and Slaybaugh Donna
Home Financials for this Owner
Home Financials are based on the most recent Mortgage that was taken out on this home.
Original Mortgage
$209,000
Interest Rate
4.08%
Mortgage Type
Adjustable Rate Mortgage/ARM
Create a Home Valuation Report for This Property
The Home Valuation Report is an in-depth analysis detailing your home's value as well as a comparison with similar homes in the area
Home Values in the Area
Average Home Value in this Area
Purchase History
| Date | Buyer | Sale Price | Title Company |
|---|---|---|---|
| Terrence And Donna Slaybaugh Revocable Living | -- | None Listed On Document | |
| Slaybaugh Terrence | -- | None Available | |
| Slaybaugh Terrence | $229,000 | Attorney |
Source: Public Records
Mortgage History
| Date | Status | Borrower | Loan Amount |
|---|---|---|---|
| Previous Owner | Slaybaugh Terrence | $25,000 | |
| Previous Owner | Slaybaugh Terrence | $209,000 | |
| Previous Owner | Kelley Alan | $293,400 |
Source: Public Records
Tax History Compared to Growth
Tax History
| Year | Tax Paid | Tax Assessment Tax Assessment Total Assessment is a certain percentage of the fair market value that is determined by local assessors to be the total taxable value of land and additions on the property. | Land | Improvement |
|---|---|---|---|---|
| 2024 | $6,502 | $116,720 | $25,440 | $91,280 |
| 2023 | $6,502 | $116,720 | $25,440 | $91,280 |
| 2022 | $6,624 | $91,710 | $20,030 | $71,680 |
| 2021 | $6,588 | $91,710 | $20,030 | $71,680 |
| 2020 | $6,574 | $91,710 | $20,030 | $71,680 |
| 2019 | $6,344 | $79,780 | $20,030 | $59,750 |
| 2018 | $6,354 | $79,780 | $20,030 | $59,750 |
| 2017 | $6,303 | $79,780 | $20,030 | $59,750 |
| 2016 | $6,578 | $79,230 | $20,030 | $59,200 |
| 2015 | $6,218 | $79,230 | $20,030 | $59,200 |
| 2014 | $6,218 | $79,230 | $20,030 | $59,200 |
| 2012 | -- | $74,350 | $14,860 | $59,490 |
Source: Public Records
Map
Nearby Homes
- 0 Pointe Oakwood Way Unit 928860
- 234 Rubicon Rd
- 225 Haver Rd
- 411 Volusia Ave
- 201 Southview Rd
- 111 Katharine Terrace
- 87 Thruston Blvd E
- 901 Runnymede Rd
- 57 Grady Ct
- 710 Harman Ave
- 51 Harman Terrace
- 910 Runnymede Rd
- 333 W Stewart St
- 305 Wyoming St
- 1020 Little Woods Rd
- 337 Wyoming St
- 63 Park Dr
- 238 Oak St
- 43 Briar Hill Rd
- 308 Smith St