Estimated Value: $291,000 - $316,000
2
Beds
2
Baths
2,056
Sq Ft
$148/Sq Ft
Est. Value
About This Home
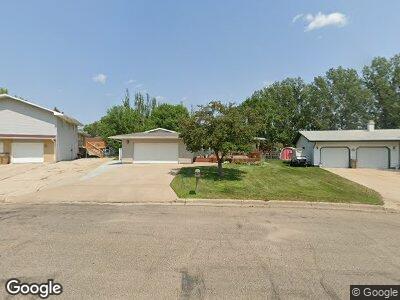
This home is located at 1833 14th St SW, Minot, ND 58701 and is currently estimated at $304,257, approximately $147 per square foot. 1833 14th St SW is a home located in Ward County with nearby schools including Edison Elementary School, Jim Hill Middle School, and Magic City Campus High School.
Ownership History
Date
Name
Owned For
Owner Type
Purchase Details
Closed on
Sep 25, 2024
Sold by
Braunberger Shirley A
Bought by
Brothen Donovan and Brothen Emily
Current Estimated Value
Home Financials for this Owner
Home Financials are based on the most recent Mortgage that was taken out on this home.
Original Mortgage
$270,000
Outstanding Balance
$268,513
Interest Rate
6.49%
Mortgage Type
New Conventional
Estimated Equity
$35,744
Purchase Details
Closed on
Sep 11, 2024
Sold by
Hatlestad Lynelle and Schmidt Ranae
Bought by
Hatlestad Lynelle and Schmidt Ranae
Home Financials for this Owner
Home Financials are based on the most recent Mortgage that was taken out on this home.
Original Mortgage
$270,000
Outstanding Balance
$268,513
Interest Rate
6.49%
Mortgage Type
New Conventional
Estimated Equity
$35,744
Purchase Details
Closed on
Jul 15, 2013
Sold by
Braunberger Shirley A
Bought by
Hatlestad Lynelle and Schmidt Ranae
Create a Home Valuation Report for This Property
The Home Valuation Report is an in-depth analysis detailing your home's value as well as a comparison with similar homes in the area
Home Values in the Area
Average Home Value in this Area
Purchase History
| Date | Buyer | Sale Price | Title Company |
|---|---|---|---|
| Brothen Donovan | $320,000 | Title Team | |
| Hatlestad Lynelle | -- | Title Team | |
| Hatlestad Lynelle | -- | None Available |
Source: Public Records
Mortgage History
| Date | Status | Borrower | Loan Amount |
|---|---|---|---|
| Open | Brothen Donovan | $270,000 | |
| Previous Owner | Braunberger Shirley A | $16,118 | |
| Previous Owner | Braunberger Melvin | $19,852 | |
| Previous Owner | Braunberger Melvin | $17,000 |
Source: Public Records
Tax History Compared to Growth
Tax History
| Year | Tax Paid | Tax Assessment Tax Assessment Total Assessment is a certain percentage of the fair market value that is determined by local assessors to be the total taxable value of land and additions on the property. | Land | Improvement |
|---|---|---|---|---|
| 2024 | $1,969 | $139,000 | $32,500 | $106,500 |
| 2023 | $1,003 | $130,500 | $32,500 | $98,000 |
| 2022 | $3,452 | $122,500 | $32,500 | $90,000 |
| 2021 | $3,169 | $117,500 | $32,500 | $85,000 |
| 2020 | $2,692 | $115,000 | $32,500 | $82,500 |
| 2019 | $2,583 | $110,000 | $37,000 | $73,000 |
| 2018 | $3,038 | $113,500 | $37,000 | $76,500 |
| 2017 | $2,900 | $117,000 | $43,500 | $73,500 |
| 2016 | $2,117 | $119,500 | $43,500 | $76,000 |
| 2015 | $2,650 | $119,500 | $0 | $0 |
| 2014 | $2,650 | $119,500 | $0 | $0 |
Source: Public Records
Map
Nearby Homes
- 1815 12 1 2 St SW
- 1829 15th St SW
- TBD 13th St SW
- 1419 17 1/2 Ave SW
- 1513 18th Ave SW Unit Breckenridge Condomi
- 1836 10th St SW
- 1852 16th St SW Unit 24
- 1433 15th St SW
- 1530 Cook Dr
- 1833 7th St SW
- 811 16th Ave SW
- 826 24th Ave SW Unit 7
- 1644 14th Ave SW
- 1420 10th St SW
- 1541 7th St SW
- 1425 9th St SW
- 405 19th Ave SW
- 1442 7th St SW
- 1516 6th St SW
- 1500 18th St SW