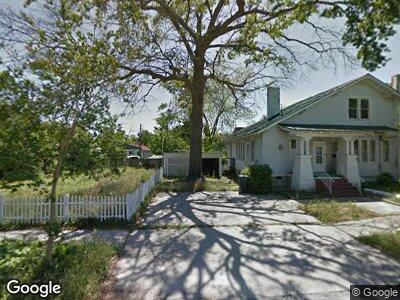
1842 Jenkins St Augusta, GA 30904
Harrisburg NeighborhoodEstimated Value: $135,000 - $179,000
5
Beds
3
Baths
2,750
Sq Ft
$60/Sq Ft
Est. Value
About This Home
This home is located at 1842 Jenkins St, Augusta, GA 30904 and is currently estimated at $164,088, approximately $59 per square foot. 1842 Jenkins St is a home located in Richmond County with nearby schools including Monte Sano Elementary School, Johnson Magnet, and Langford Middle School.
Ownership History
Date
Name
Owned For
Owner Type
Purchase Details
Closed on
May 9, 2005
Sold by
Thompson Mona J
Bought by
Allen Twighla A and Allen Eric M
Current Estimated Value
Home Financials for this Owner
Home Financials are based on the most recent Mortgage that was taken out on this home.
Original Mortgage
$101,398
Outstanding Balance
$56,011
Interest Rate
5.98%
Mortgage Type
Fannie Mae Freddie Mac
Estimated Equity
$118,125
Purchase Details
Closed on
May 4, 2005
Sold by
Oneal Thomas Dale
Bought by
Thompson Mona J
Home Financials for this Owner
Home Financials are based on the most recent Mortgage that was taken out on this home.
Original Mortgage
$101,398
Outstanding Balance
$56,011
Interest Rate
5.98%
Mortgage Type
Fannie Mae Freddie Mac
Estimated Equity
$118,125
Purchase Details
Closed on
Jul 12, 2000
Sold by
Thompson Mona J
Bought by
Thompson Mona J and Oneal Flora C
Home Financials for this Owner
Home Financials are based on the most recent Mortgage that was taken out on this home.
Original Mortgage
$49,500
Interest Rate
8.54%
Mortgage Type
Purchase Money Mortgage
Purchase Details
Closed on
Feb 25, 1997
Sold by
Hancock Nell Miss
Bought by
Hancock Nell Miss
Create a Home Valuation Report for This Property
The Home Valuation Report is an in-depth analysis detailing your home's value as well as a comparison with similar homes in the area
Home Values in the Area
Average Home Value in this Area
Purchase History
| Date | Buyer | Sale Price | Title Company |
|---|---|---|---|
| Allen Twighla A | $99,900 | -- | |
| Thompson Mona J | -- | -- | |
| Thompson Mona J | -- | -- | |
| Thompson Mona J | -- | -- | |
| Thompson Mona J | $55,000 | -- | |
| Hancock Nell Miss | -- | -- |
Source: Public Records
Mortgage History
| Date | Status | Borrower | Loan Amount |
|---|---|---|---|
| Open | Thompson Mona J | $101,398 | |
| Previous Owner | Thompson Mona J | $49,500 |
Source: Public Records
Tax History Compared to Growth
Tax History
| Year | Tax Paid | Tax Assessment Tax Assessment Total Assessment is a certain percentage of the fair market value that is determined by local assessors to be the total taxable value of land and additions on the property. | Land | Improvement |
|---|---|---|---|---|
| 2024 | $1,834 | $33,155 | $3,720 | $29,435 |
| 2023 | $1,834 | $32,705 | $3,720 | $28,985 |
| 2022 | $1,706 | $35,481 | $3,720 | $31,761 |
| 2021 | $1,459 | $24,956 | $3,738 | $21,218 |
| 2020 | $1,329 | $21,429 | $3,960 | $17,469 |
| 2019 | $1,650 | $29,058 | $3,960 | $25,098 |
| 2018 | $1,659 | $29,058 | $3,960 | $25,098 |
| 2017 | $1,653 | $29,058 | $3,960 | $25,098 |
| 2016 | $1,654 | $29,058 | $3,960 | $25,098 |
| 2015 | $1,972 | $29,058 | $3,960 | $25,098 |
| 2014 | $1,663 | $29,058 | $3,960 | $25,098 |
Source: Public Records
Map
Nearby Homes
- 1910 Warren St
- 1835 Starnes St
- 1930 Warren St
- 1843 Blairs Ln
- 934 Murphy St
- 1815 Fenwick St
- 1826 Howard Ave
- 1921 Fenwick St
- 1004 Murphy St
- 642 Crawford Ave
- 1825 Watkins St
- 1851 Wilhelm Ln
- 622 Crawford Ave
- 605 Eve St
- 1858 Walker St
- 2015 Starnes St
- 930 Holden Dr
- 1968 Battle Row
- 1962 Battle Row
- 1742 Walker St