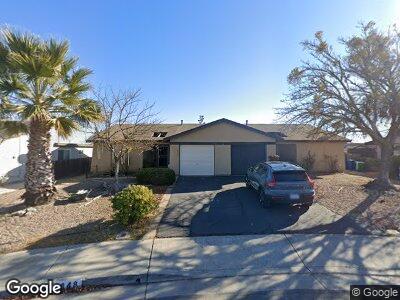
1848 Southview Cir Paso Robles, CA 93446
Estimated Value: $427,000 - $484,000
2
Beds
2
Baths
923
Sq Ft
$486/Sq Ft
Est. Value
About This Home
This home is located at 1848 Southview Cir, Paso Robles, CA 93446 and is currently estimated at $448,387, approximately $485 per square foot. 1848 Southview Cir is a home located in San Luis Obispo County with nearby schools including Virginia Peterson Elementary School, Daniel Lewis Middle School, and Paso Robles High School.
Ownership History
Date
Name
Owned For
Owner Type
Purchase Details
Closed on
May 28, 2024
Sold by
Kumskow Lydia
Bought by
Lydia Kumskow Revocable Trust and Kumskow
Current Estimated Value
Purchase Details
Closed on
Aug 11, 2021
Sold by
Powers James H
Bought by
Powers James H and Kumskow Lydia
Purchase Details
Closed on
Apr 27, 2018
Sold by
Thompson Melvin A and Thompson Brian Eugene
Bought by
Powers James H
Home Financials for this Owner
Home Financials are based on the most recent Mortgage that was taken out on this home.
Original Mortgage
$213,750
Interest Rate
4.44%
Mortgage Type
New Conventional
Purchase Details
Closed on
Aug 12, 1999
Sold by
Ranch & Coast Properties Inc
Bought by
Mendoza Jose and Mendoza Betty
Home Financials for this Owner
Home Financials are based on the most recent Mortgage that was taken out on this home.
Original Mortgage
$156,000
Interest Rate
7.7%
Mortgage Type
Seller Take Back
Create a Home Valuation Report for This Property
The Home Valuation Report is an in-depth analysis detailing your home's value as well as a comparison with similar homes in the area
Home Values in the Area
Average Home Value in this Area
Purchase History
| Date | Buyer | Sale Price | Title Company |
|---|---|---|---|
| Lydia Kumskow Revocable Trust | -- | None Listed On Document | |
| Powers James H | -- | None Listed On Document | |
| Powers James H | $285,000 | Fidelity National Title Co | |
| Mendoza Jose | $80,000 | First American Title Ins Co |
Source: Public Records
Mortgage History
| Date | Status | Borrower | Loan Amount |
|---|---|---|---|
| Previous Owner | Powers James H | $209,500 | |
| Previous Owner | Powers James H | $213,750 | |
| Previous Owner | Mendoza Jose | $156,000 |
Source: Public Records
Tax History Compared to Growth
Tax History
| Year | Tax Paid | Tax Assessment Tax Assessment Total Assessment is a certain percentage of the fair market value that is determined by local assessors to be the total taxable value of land and additions on the property. | Land | Improvement |
|---|---|---|---|---|
| 2024 | $3,477 | $317,919 | $200,792 | $117,127 |
| 2023 | $3,477 | $311,686 | $196,855 | $114,831 |
| 2022 | $3,425 | $305,576 | $192,996 | $112,580 |
| 2021 | $3,367 | $299,585 | $189,212 | $110,373 |
| 2020 | $3,321 | $296,514 | $187,272 | $109,242 |
| 2019 | $3,274 | $290,700 | $183,600 | $107,100 |
| 2018 | $1,616 | $142,639 | $87,171 | $55,468 |
| 2017 | $1,520 | $139,843 | $85,462 | $54,381 |
| 2016 | $1,490 | $137,102 | $83,787 | $53,315 |
| 2015 | $1,484 | $135,044 | $82,529 | $52,515 |
| 2014 | $1,433 | $132,400 | $80,913 | $51,487 |
Source: Public Records
Map
Nearby Homes
- 1743 Northview Place
- 891 Sycamore Canyon Rd
- 2304 Latigo Ct
- 1509 Trinity Ct
- 1504 Plumas Ct
- 902 Sycamore Canyon Rd
- 1813 Shepherd Dr
- 414 Cool Valley Dr
- 1939 Tulipwood Dr
- 198 Santa Ynez Ave
- 295 San Fernando Dr
- 375 Partridge Ave
- 2488 Starling Dr
- 334 Lark Dr
- 338 Partridge Ave
- 330 Lark Dr
- 374 Bobwhite
- 321 Lark Dr
- 8 Dove Ct
- 341 Quail Summit