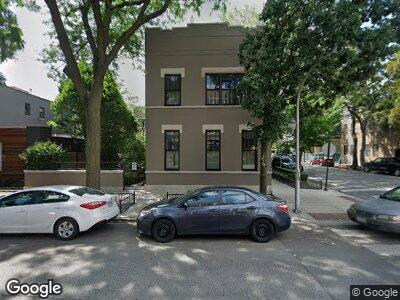
1859 W Wabansia Ave Chicago, IL 60622
Wicker Park NeighborhoodEstimated Value: $1,730,000 - $2,624,000
4
Beds
4
Baths
4,568
Sq Ft
$435/Sq Ft
Est. Value
About This Home
This home is located at 1859 W Wabansia Ave, Chicago, IL 60622 and is currently estimated at $1,988,625, approximately $435 per square foot. 1859 W Wabansia Ave is a home located in Cook County with nearby schools including Jonathan Burr Elementary, Wells Community Academy High School, and Guidepost Montessori at Wicker Park.
Ownership History
Date
Name
Owned For
Owner Type
Purchase Details
Closed on
Dec 4, 2020
Sold by
Lowe Jeffrey S and Lowe Mary M
Bought by
Lowe Jeffrey S and Lowe Mary M
Current Estimated Value
Purchase Details
Closed on
Jul 14, 2006
Sold by
Lowe Jeffrey S and Lowe Mary M
Bought by
Lowe Jeffrey S and Lowe Mary M
Purchase Details
Closed on
Sep 7, 2004
Sold by
Blocker James J and Blocker Marcia H
Bought by
Lowe Jeffrey S and Lowe Mary M
Home Financials for this Owner
Home Financials are based on the most recent Mortgage that was taken out on this home.
Original Mortgage
$1,700,000
Interest Rate
4.5%
Mortgage Type
Construction
Purchase Details
Closed on
Sep 4, 2003
Sold by
Cole Taylor Bank
Bought by
Blocker James J and Blocker Marcia H
Create a Home Valuation Report for This Property
The Home Valuation Report is an in-depth analysis detailing your home's value as well as a comparison with similar homes in the area
Home Values in the Area
Average Home Value in this Area
Purchase History
| Date | Buyer | Sale Price | Title Company |
|---|---|---|---|
| Lowe Jeffrey S | -- | Attorneys Ttl Guaranty Fund | |
| Lowe Jeffrey S | -- | None Available | |
| Lowe Jeffrey S | $1,000,000 | Multiple | |
| Blocker James J | -- | -- |
Source: Public Records
Mortgage History
| Date | Status | Borrower | Loan Amount |
|---|---|---|---|
| Open | Lowe Family Revocable Family T | $1,335,000 | |
| Closed | Lowe Jeffrey S | $1,475,000 | |
| Closed | Lowe Jeffrey S | $1,480,000 | |
| Closed | Lowe Jeffrey S | $1,495,000 | |
| Closed | Lowe Jeffrey S | $2,140,000 | |
| Closed | Lowe Jeffrey S | $1,920,000 | |
| Closed | Lowe Jeffrey S | $1,700,000 |
Source: Public Records
Tax History Compared to Growth
Tax History
| Year | Tax Paid | Tax Assessment Tax Assessment Total Assessment is a certain percentage of the fair market value that is determined by local assessors to be the total taxable value of land and additions on the property. | Land | Improvement |
|---|---|---|---|---|
| 2024 | $36,216 | $176,284 | $16,843 | $159,441 |
| 2023 | $36,216 | $179,155 | $13,552 | $165,603 |
| 2022 | $36,216 | $179,155 | $13,552 | $165,603 |
| 2021 | $35,424 | $179,154 | $13,552 | $165,602 |
| 2020 | $21,456 | $99,108 | $8,808 | $90,300 |
| 2019 | $21,147 | $108,340 | $8,808 | $99,532 |
| 2018 | $20,790 | $108,340 | $8,808 | $99,532 |
| 2017 | $12,138 | $59,422 | $7,744 | $51,678 |
| 2016 | $11,451 | $59,422 | $7,744 | $51,678 |
| 2015 | $11,282 | $63,929 | $7,744 | $56,185 |
| 2014 | $7,719 | $43,915 | $6,776 | $37,139 |
| 2013 | $7,557 | $43,915 | $6,776 | $37,139 |
Source: Public Records
Map
Nearby Homes
- 1835 W Wabansia Ave
- 1722 N Winchester Ave
- 1616 N Winchester Ave
- 1701 N Damen Ave Unit 305
- 1849 W North Ave Unit 10
- 1750 N Wolcott Ave Unit 103
- 1748 W North Ave
- 1720 N Hermitage Ave
- 2013 W Concord Place Unit CH-2
- 1547 N Honore St Unit 1
- 2012 W Willow St
- 1767 N Hoyne Ave Unit I
- 1531 N Wood St
- 1634 N Milwaukee Ave Unit 3F
- 2024 W Willow St Unit A
- 1913 W Cortland St
- 1735 N Hoyne Ave
- 1735 N Paulina St Unit 606
- 1735 N Paulina St Unit 604
- 2050 W Willow St Unit E