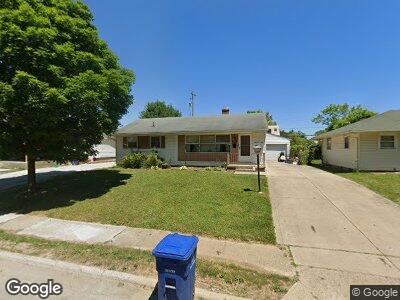
1860 Fenton St Columbus, OH 43224
North Linden NeighborhoodEstimated Value: $172,000 - $194,000
3
Beds
1
Bath
960
Sq Ft
$193/Sq Ft
Est. Value
About This Home
This home is located at 1860 Fenton St, Columbus, OH 43224 and is currently estimated at $185,560, approximately $193 per square foot. 1860 Fenton St is a home located in Franklin County with nearby schools including North Linden Elementary School, Medina Middle School, and Mifflin High School.
Ownership History
Date
Name
Owned For
Owner Type
Purchase Details
Closed on
Aug 28, 2006
Sold by
Triad Guaranty Insurance Corp
Bought by
Mackensen David W and Mackensen Cora E
Current Estimated Value
Home Financials for this Owner
Home Financials are based on the most recent Mortgage that was taken out on this home.
Original Mortgage
$73,300
Interest Rate
6.58%
Mortgage Type
Purchase Money Mortgage
Purchase Details
Closed on
Dec 9, 2005
Sold by
Federal National Mortgage Association
Bought by
Triad Guaranty Insurance Corp
Purchase Details
Closed on
May 11, 2005
Sold by
Jones Leonard R
Bought by
Federal National Mortgage Association
Purchase Details
Closed on
May 12, 1997
Sold by
Ort John J Tr
Bought by
Jones Leonard R
Home Financials for this Owner
Home Financials are based on the most recent Mortgage that was taken out on this home.
Original Mortgage
$66,975
Interest Rate
8.27%
Purchase Details
Closed on
Jun 20, 1991
Create a Home Valuation Report for This Property
The Home Valuation Report is an in-depth analysis detailing your home's value as well as a comparison with similar homes in the area
Home Values in the Area
Average Home Value in this Area
Purchase History
| Date | Buyer | Sale Price | Title Company |
|---|---|---|---|
| Mackensen David W | $83,300 | Talon Group | |
| Triad Guaranty Insurance Corp | $54,000 | Talon Group | |
| Federal National Mortgage Association | $67,000 | -- | |
| Jones Leonard R | $70,500 | -- | |
| -- | -- | -- |
Source: Public Records
Mortgage History
| Date | Status | Borrower | Loan Amount |
|---|---|---|---|
| Open | Mackensen Cora E | $13,000 | |
| Open | Mackensen David W | $63,614 | |
| Closed | Mackensen David W | $20,040 | |
| Closed | Mackensen David W | $10,072 | |
| Closed | Mackensen David W | $73,300 | |
| Previous Owner | Jones Leonard R | $66,975 |
Source: Public Records
Tax History Compared to Growth
Tax History
| Year | Tax Paid | Tax Assessment Tax Assessment Total Assessment is a certain percentage of the fair market value that is determined by local assessors to be the total taxable value of land and additions on the property. | Land | Improvement |
|---|---|---|---|---|
| 2024 | $2,096 | $56,500 | $12,360 | $44,140 |
| 2023 | $2,097 | $56,500 | $12,360 | $44,140 |
| 2022 | $926 | $26,610 | $5,570 | $21,040 |
| 2021 | $928 | $26,610 | $5,570 | $21,040 |
| 2020 | $929 | $26,610 | $5,570 | $21,040 |
| 2019 | $723 | $20,660 | $4,450 | $16,210 |
| 2018 | $842 | $20,660 | $4,450 | $16,210 |
| 2017 | $722 | $20,660 | $4,450 | $16,210 |
| 2016 | $1,060 | $24,750 | $4,130 | $20,620 |
| 2015 | $962 | $24,750 | $4,130 | $20,620 |
| 2014 | $965 | $24,750 | $4,130 | $20,620 |
| 2013 | $557 | $27,475 | $4,585 | $22,890 |
Source: Public Records
Map
Nearby Homes
- 1946 Lehner Rd
- 1870 Ward Rd
- 1863 Ward Rd
- 2104 Colfax Ave
- 1800 Ormond Ave
- 3915 Walford St
- 1850 Radnor Ave
- 1542 Fowler Dr
- 4115 Karl Rd Unit A302
- 4143 Karl Rd Unit 113
- 2261 Colfax Ave
- 1453 Matthias Dr
- 4119 Karl Rd Unit C104
- 1751 E Cooke Rd
- 1873 E Cooke Rd
- 2320 Ashley Dr
- 1398 Matthias Dr
- 2220 Sale Rd
- 3965 Karl Rd Unit 100
- 3965 Karl Rd Unit 301