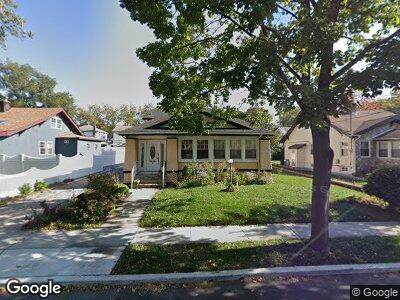
18818 Ilion Ave Saint Albans, NY 11412
Hollis NeighborhoodEstimated Value: $780,000 - $941,000
--
Bed
4
Baths
1,696
Sq Ft
$522/Sq Ft
Est. Value
About This Home
This home is located at 18818 Ilion Ave, Saint Albans, NY 11412 and is currently estimated at $885,280, approximately $521 per square foot. 18818 Ilion Ave is a home located in Queens County with nearby schools including P.S. 118 Lorraine Hansberry, I.S. 192 The Linden, and Wellspring Elementary & Middle.
Ownership History
Date
Name
Owned For
Owner Type
Purchase Details
Closed on
Oct 31, 2023
Sold by
Campbell Nicola
Bought by
Mclean Floyd and Wint Anrose
Current Estimated Value
Home Financials for this Owner
Home Financials are based on the most recent Mortgage that was taken out on this home.
Original Mortgage
$866,096
Outstanding Balance
$854,176
Interest Rate
7.31%
Mortgage Type
Purchase Money Mortgage
Estimated Equity
$31,104
Purchase Details
Closed on
May 4, 2021
Sold by
Smith Christopher
Bought by
Campbell Nicola
Purchase Details
Closed on
Sep 10, 2001
Sold by
Reid Davette P
Bought by
Smith Christopher
Home Financials for this Owner
Home Financials are based on the most recent Mortgage that was taken out on this home.
Original Mortgage
$160,000
Interest Rate
6.7%
Mortgage Type
Purchase Money Mortgage
Create a Home Valuation Report for This Property
The Home Valuation Report is an in-depth analysis detailing your home's value as well as a comparison with similar homes in the area
Home Values in the Area
Average Home Value in this Area
Purchase History
| Date | Buyer | Sale Price | Title Company |
|---|---|---|---|
| Mclean Floyd | $896,000 | -- | |
| Mclean Floyd | $896,000 | -- | |
| Campbell Nicola | -- | -- | |
| Campbell Nicola | -- | -- | |
| Smith Christopher | -- | -- | |
| Smith Christopher | -- | -- |
Source: Public Records
Mortgage History
| Date | Status | Borrower | Loan Amount |
|---|---|---|---|
| Open | Mclean Floyd | $866,096 | |
| Closed | Mclean Floyd | $866,096 | |
| Previous Owner | Smith Christopher | $400,000 | |
| Previous Owner | Smith Christopher | $160,000 |
Source: Public Records
Tax History Compared to Growth
Tax History
| Year | Tax Paid | Tax Assessment Tax Assessment Total Assessment is a certain percentage of the fair market value that is determined by local assessors to be the total taxable value of land and additions on the property. | Land | Improvement |
|---|---|---|---|---|
| 2024 | $6,664 | $33,178 | $12,471 | $20,707 |
| 2023 | $6,664 | $33,178 | $11,310 | $21,868 |
| 2022 | $6,527 | $39,720 | $16,260 | $23,460 |
| 2021 | $6,492 | $33,840 | $16,260 | $17,580 |
| 2020 | $6,160 | $29,100 | $16,260 | $12,840 |
| 2019 | $5,784 | $31,140 | $16,260 | $14,880 |
| 2018 | $5,636 | $27,648 | $13,122 | $14,526 |
| 2017 | $5,594 | $27,440 | $14,725 | $12,715 |
| 2016 | $5,175 | $27,440 | $14,725 | $12,715 |
| 2015 | $3,227 | $24,422 | $15,946 | $8,476 |
| 2014 | $3,227 | $23,040 | $18,060 | $4,980 |
Source: Public Records
Map
Nearby Homes
- 18823 Mangin Ave
- 186-16 Hilburn Ave
- 18806 Brinkerhoff Ave
- 186-20 Brinkerhoff Ave
- 18833 Keeseville Ave
- 18626 Elmira Ave
- 188-05 Liberty Ave
- 10533 Farmers Blvd
- 11259 Mayville St
- 190-43 112th Ave
- 10929 192nd St
- 183-65 Elmira Ave
- 18707 Mangin Ave
- 183-29 Brinkerhoff Ave
- 105-11 187th St
- 191-40 112th Rd
- 193-21 109th Rd
- 183-12 Elmira Ave
- 183-67 Dunlop Ave
- 10421 189th St