Estimated Value: $45,000 - $66,566
--
Bed
1
Bath
812
Sq Ft
$68/Sq Ft
Est. Value
About This Home
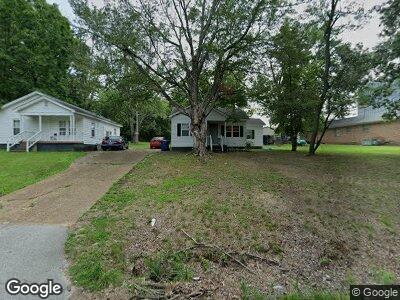
This home is located at 189 E South St, Dyer, TN 38330 and is currently estimated at $55,142, approximately $67 per square foot. 189 E South St is a home located in Gibson County with nearby schools including Dyer Elementary School and Gibson County High School.
Ownership History
Date
Name
Owned For
Owner Type
Purchase Details
Closed on
Sep 22, 2023
Sold by
Faulkner Jerry
Bought by
Venture 176 Llc
Current Estimated Value
Home Financials for this Owner
Home Financials are based on the most recent Mortgage that was taken out on this home.
Original Mortgage
$720,255
Outstanding Balance
$697,031
Interest Rate
6.96%
Mortgage Type
New Conventional
Estimated Equity
-$641,742
Purchase Details
Closed on
Apr 13, 1996
Bought by
Carson Scott
Purchase Details
Closed on
May 27, 1993
Bought by
Hopper Anthony
Purchase Details
Closed on
Apr 26, 1960
Bought by
Puckett Lala B Mrs
Create a Home Valuation Report for This Property
The Home Valuation Report is an in-depth analysis detailing your home's value as well as a comparison with similar homes in the area
Home Values in the Area
Average Home Value in this Area
Purchase History
| Date | Buyer | Sale Price | Title Company |
|---|---|---|---|
| Venture 176 Llc | $650,000 | Dyer Land Title | |
| Carson Scott | $31,000 | -- | |
| Hopper Anthony | $4,000 | -- | |
| Puckett Lala B Mrs | -- | -- |
Source: Public Records
Mortgage History
| Date | Status | Borrower | Loan Amount |
|---|---|---|---|
| Open | Venture 176 Llc | $720,255 | |
| Previous Owner | Faulkner Among Jerry | $127,500 |
Source: Public Records
Tax History Compared to Growth
Tax History
| Year | Tax Paid | Tax Assessment Tax Assessment Total Assessment is a certain percentage of the fair market value that is determined by local assessors to be the total taxable value of land and additions on the property. | Land | Improvement |
|---|---|---|---|---|
| 2024 | $413 | $11,925 | $2,250 | $9,675 |
| 2023 | $198 | $6,375 | $950 | $5,425 |
| 2022 | $194 | $6,375 | $950 | $5,425 |
| 2021 | $194 | $6,375 | $950 | $5,425 |
| 2020 | $317 | $6,375 | $950 | $5,425 |
| 2019 | $317 | $6,375 | $950 | $5,425 |
| 2018 | $328 | $6,500 | $950 | $5,550 |
| 2017 | $315 | $6,500 | $950 | $5,550 |
| 2016 | $315 | $6,500 | $950 | $5,550 |
| 2015 | $287 | $6,500 | $950 | $5,550 |
| 2014 | $287 | $6,500 | $950 | $5,550 |
Source: Public Records
Map
Nearby Homes