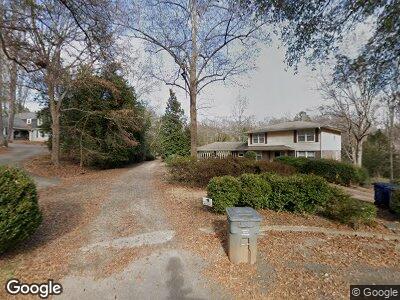
189 Henson St Spartanburg, SC 29307
Hillbrook NeighborhoodEstimated Value: $466,000 - $512,725
6
Beds
6
Baths
3,911
Sq Ft
$125/Sq Ft
Est. Value
About This Home
This home is located at 189 Henson St, Spartanburg, SC 29307 and is currently estimated at $486,931, approximately $124 per square foot. 189 Henson St is a home located in Spartanburg County with nearby schools including Spartanburg High School, Westminster Day School, and Spartanburg Day School.
Ownership History
Date
Name
Owned For
Owner Type
Purchase Details
Closed on
Feb 20, 2024
Sold by
Kiser Randall and Kiser Dedra H
Bought by
Starr Marshall R and Starr Tina L
Current Estimated Value
Home Financials for this Owner
Home Financials are based on the most recent Mortgage that was taken out on this home.
Original Mortgage
$453,487
Outstanding Balance
$444,821
Interest Rate
4%
Mortgage Type
VA
Estimated Equity
$31,467
Purchase Details
Closed on
Mar 28, 2014
Sold by
Kuhens Brian and Kuhens Donna
Bought by
Kiser Ii Randall M and Kiser Dedra H
Home Financials for this Owner
Home Financials are based on the most recent Mortgage that was taken out on this home.
Original Mortgage
$225,000
Interest Rate
4.4%
Mortgage Type
FHA
Purchase Details
Closed on
Aug 26, 2002
Sold by
Bell Philip J and Watson Alice K
Bought by
Kuhens Brian and Kuhens Donna
Purchase Details
Closed on
Jul 3, 2001
Sold by
Watson Alice K
Bought by
Bell Philip J
Create a Home Valuation Report for This Property
The Home Valuation Report is an in-depth analysis detailing your home's value as well as a comparison with similar homes in the area
Home Values in the Area
Average Home Value in this Area
Purchase History
| Date | Buyer | Sale Price | Title Company |
|---|---|---|---|
| Starr Marshall R | $439,000 | None Listed On Document | |
| Kiser Ii Randall M | $250,000 | -- | |
| Kuhens Brian | $252,000 | -- | |
| Bell Philip J | -- | -- |
Source: Public Records
Mortgage History
| Date | Status | Borrower | Loan Amount |
|---|---|---|---|
| Open | Starr Marshall R | $453,487 | |
| Previous Owner | Kiser Randall M | $102 | |
| Previous Owner | Kiser Ii Randall M | $59,544 | |
| Previous Owner | Kiser Ii Randall M | $225,000 | |
| Previous Owner | Kuhens Brian | $219,000 | |
| Previous Owner | Kuhens Brian | $72,008 | |
| Previous Owner | Kuhens Brian | $2,360,000 |
Source: Public Records
Tax History Compared to Growth
Tax History
| Year | Tax Paid | Tax Assessment Tax Assessment Total Assessment is a certain percentage of the fair market value that is determined by local assessors to be the total taxable value of land and additions on the property. | Land | Improvement |
|---|---|---|---|---|
| 2024 | $3,694 | $12,967 | $2,956 | $10,011 |
| 2023 | $3,694 | $12,967 | $2,956 | $10,011 |
| 2022 | $3,159 | $11,276 | $3,072 | $8,204 |
| 2021 | $3,159 | $11,276 | $3,072 | $8,204 |
| 2020 | $3,130 | $11,276 | $3,072 | $8,204 |
| 2019 | $3,130 | $11,276 | $3,072 | $8,204 |
| 2018 | $3,130 | $11,276 | $3,072 | $8,204 |
| 2017 | $2,820 | $9,960 | $3,072 | $6,888 |
| 2016 | $2,820 | $9,960 | $3,072 | $6,888 |
| 2015 | $2,701 | $9,960 | $3,072 | $6,888 |
| 2014 | $2,696 | $9,960 | $3,072 | $6,888 |
Source: Public Records
Map
Nearby Homes
- 507 Perrin Dr
- 608 Blossom Run
- 218 S Carleila Lake Way
- 471 Webber Rd
- 120 Hillbrook Dr
- 1105 Webber Way
- 1122 Webber Way
- 110 Hillbrook Dr
- 664 Perrin Dr
- 243 Harrell Dr
- 101 Mabry Dr
- 1594 Fernwood Glendale Rd
- 109 Loche Adele Dr
- 10 Summercreek Dr Unit 5D
- 114 Gable Ct
- 448 Ransdell Dr
- 1628 Fernwood Glendale Rd
- 1866 Old Charlotte Rd
- 109 Clemson St
- 250 Hollis Dr