19 Timber Leaf Dr Greenville, SC 29605
Gantt NeighborhoodEstimated Value: $122,238 - $220,000
--
Bed
--
Bath
1,040
Sq Ft
$172/Sq Ft
Est. Value
About This Home
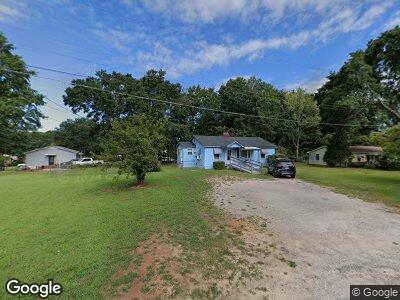
This home is located at 19 Timber Leaf Dr, Greenville, SC 29605 and is currently estimated at $179,060, approximately $172 per square foot. 19 Timber Leaf Dr is a home located in Greenville County with nearby schools including Thomas E. Kerns Elementary School, Tanglewood Middle, and Southside High School.
Ownership History
Date
Name
Owned For
Owner Type
Purchase Details
Closed on
Jul 6, 2017
Sold by
The Estate Of Yvonne Sherman Johnson
Bought by
Johnson Velma Rebecca and Johnson Montauge Orrick
Current Estimated Value
Purchase Details
Closed on
Mar 27, 2015
Sold by
Abraham Bobby J
Bought by
Johnson Yvonne S
Purchase Details
Closed on
Feb 19, 2015
Sold by
Gaines Gerrilene S
Bought by
Johnson Yvonne S
Purchase Details
Closed on
Feb 9, 2015
Sold by
Davidson Jack Herman and Davidson Trevor Demetris
Bought by
Johnson Yvonne S
Purchase Details
Closed on
Jan 22, 2015
Sold by
Estate Of Sarah Elizabeth Davidson and Davidson Jack Herman
Bought by
Davidson Jack Herman and Davidson Shannon D Von
Purchase Details
Closed on
Aug 25, 2014
Sold by
Pendergrass Freddie B
Bought by
Johnson Yvonne S
Purchase Details
Closed on
Dec 10, 2003
Sold by
Sherman Thelma L
Bought by
Sherman Thelma L
Purchase Details
Closed on
Jan 5, 2001
Sold by
Sherman Thelma L
Bought by
Abraham Doris S
Create a Home Valuation Report for This Property
The Home Valuation Report is an in-depth analysis detailing your home's value as well as a comparison with similar homes in the area
Home Values in the Area
Average Home Value in this Area
Purchase History
| Date | Buyer | Sale Price | Title Company |
|---|---|---|---|
| Johnson Velma Rebecca | -- | None Available | |
| Johnson Yvonne S | -- | -- | |
| Abraham Bobby J | -- | -- | |
| Johnson Yvonne S | -- | -- | |
| Johnson Yvonne S | -- | -- | |
| Davidson Jack Herman | -- | -- | |
| Johnson Yvonne S | -- | -- | |
| Sherman Thelma L | -- | -- | |
| Sherman Thelma L | -- | -- | |
| Abraham Doris S | -- | -- |
Source: Public Records
Tax History Compared to Growth
Tax History
| Year | Tax Paid | Tax Assessment Tax Assessment Total Assessment is a certain percentage of the fair market value that is determined by local assessors to be the total taxable value of land and additions on the property. | Land | Improvement |
|---|---|---|---|---|
| 2024 | $650 | $2,010 | $540 | $1,470 |
| 2023 | $650 | $2,010 | $540 | $1,470 |
| 2022 | $640 | $2,010 | $540 | $1,470 |
| 2021 | $634 | $2,010 | $540 | $1,470 |
| 2020 | $685 | $1,940 | $540 | $1,400 |
| 2019 | $674 | $1,940 | $540 | $1,400 |
| 2018 | $612 | $1,940 | $540 | $1,400 |
| 2017 | $612 | $1,940 | $540 | $1,400 |
| 2016 | $201 | $48,420 | $13,500 | $34,920 |
| 2015 | $201 | $48,420 | $13,500 | $34,920 |
| 2014 | $631 | $55,418 | $13,331 | $42,087 |
Source: Public Records
Map
Nearby Homes
- 14 Woodmont Ln
- 21 Glen Burnie St
- 813 Pine Creek Dr
- 803 Pine Creek Dr
- 13 Brookforest Dr
- 9 Plainfield Cir
- 106 Brookforest Dr
- 5 Old Farm Ln
- 402 Ecton Place
- 706 White Horse Rd
- 518 Barbican Place
- 512 Barbican Place
- 510 Barbican Place
- 517 Barbican Place
- 439 Silicon Dr
- 437 Silicon Dr
- 511 Barbican Place
- 301 Widley Way
- 521 Barbican Place
- 520 Barbican Place