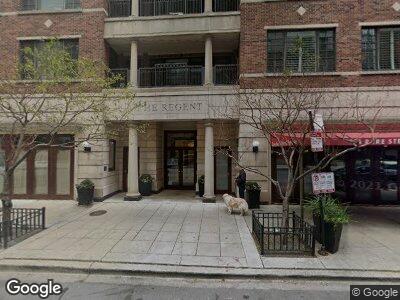
The Regent 190 E Walton Place Unit 301 Chicago, IL 60611
Gold Coast NeighborhoodEstimated Value: $796,000 - $1,350,195
--
Bed
--
Bath
59,050
Sq Ft
$20/Sq Ft
Est. Value
About This Home
This home is located at 190 E Walton Place Unit 301, Chicago, IL 60611 and is currently estimated at $1,163,732, approximately $19 per square foot. 190 E Walton Place Unit 301 is a home located in Cook County with nearby schools including Ogden Elementary School, Wells Community Academy High School, and Frances Xavier Warde School.
Ownership History
Date
Name
Owned For
Owner Type
Purchase Details
Closed on
Apr 19, 2013
Sold by
Nemickas Joan A and Nemickas Tomas E
Bought by
Nemickas Joan A and Joan A Nemickas Trust
Current Estimated Value
Home Financials for this Owner
Home Financials are based on the most recent Mortgage that was taken out on this home.
Original Mortgage
$583,300
Interest Rate
3.75%
Mortgage Type
New Conventional
Purchase Details
Closed on
Dec 10, 2011
Sold by
Nemickas Joan A and Nemickas Tomas E
Bought by
Nemickas Joan A and Nemickas Tomas E
Purchase Details
Closed on
Feb 28, 2002
Sold by
Nemickas Rimgaudas and Nemickas Joan A
Bought by
Nemickas Rimgaudas and The Rimgaudas Nemickas Trust
Create a Home Valuation Report for This Property
The Home Valuation Report is an in-depth analysis detailing your home's value as well as a comparison with similar homes in the area
Home Values in the Area
Average Home Value in this Area
Purchase History
| Date | Buyer | Sale Price | Title Company |
|---|---|---|---|
| Nemickas Joan A | -- | Fidelity National Title | |
| Nemickas Joan A | -- | None Available | |
| Nemickas Rimgaudas | -- | -- | |
| Nemickas Joan A | -- | -- |
Source: Public Records
Mortgage History
| Date | Status | Borrower | Loan Amount |
|---|---|---|---|
| Open | Nemickas Joan A | $498,000 | |
| Closed | Nemickas Joan A | $583,300 | |
| Previous Owner | Nemickas Rimgaudas | $617,500 |
Source: Public Records
Tax History Compared to Growth
Tax History
| Year | Tax Paid | Tax Assessment Tax Assessment Total Assessment is a certain percentage of the fair market value that is determined by local assessors to be the total taxable value of land and additions on the property. | Land | Improvement |
|---|---|---|---|---|
| 2024 | $25,275 | $132,236 | $29,956 | $102,280 |
| 2023 | $25,275 | $129,043 | $24,119 | $104,924 |
| 2022 | $25,275 | $129,043 | $24,119 | $104,924 |
| 2021 | $24,743 | $129,041 | $24,118 | $104,923 |
| 2020 | $26,442 | $118,699 | $16,883 | $101,816 |
| 2019 | $25,879 | $128,808 | $16,883 | $111,925 |
| 2018 | $25,444 | $128,808 | $16,883 | $111,925 |
| 2017 | $21,415 | $99,480 | $13,506 | $85,974 |
| 2016 | $19,925 | $99,480 | $13,506 | $85,974 |
| 2015 | $18,229 | $99,480 | $13,506 | $85,974 |
| 2014 | $16,234 | $91,898 | $10,853 | $81,045 |
| 2013 | $15,894 | $91,898 | $10,853 | $81,045 |
Source: Public Records
About The Regent
Map
Nearby Homes
- 190 E Walton Place Unit 502
- 179 E Lake Shore Dr Unit 603W
- 179 E Lake Shore Dr Unit 502
- 179 E Lake Shore Dr Unit 402
- 179 E Lake Shore Dr Unit 1003
- 199 E Lake Shore Dr Unit 3
- 210 E Walton Place Unit B
- 209 E Lake Shore Dr Unit 14
- 209 E Lake Shore Dr Unit 15W
- 200 E Delaware Place Unit 15E
- 200 E Delaware Place Unit 13F
- 200 E Delaware Place Unit 3D
- 200 E Delaware Place Unit 10A
- 200 E Delaware Place Unit 30C
- 200 E Delaware Place Unit 35F
- 221 E Walton Place Unit 10B
- 221 E Walton Place Unit 5B
- 159 E Walton Place Unit 34A
- 159 E Walton Place Unit 8E
- 159 E Walton Place Unit 16E