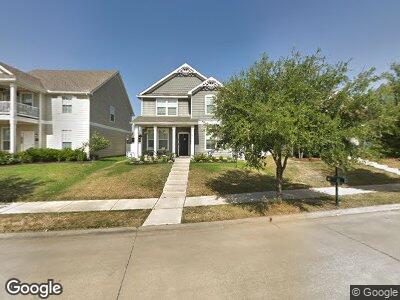
1905 Myers Ct Aubrey, TX 76227
Providence NeighborhoodEstimated Value: $313,000 - $347,000
3
Beds
3
Baths
1,940
Sq Ft
$170/Sq Ft
Est. Value
About This Home
This home is located at 1905 Myers Ct, Aubrey, TX 76227 and is currently estimated at $329,965, approximately $170 per square foot. 1905 Myers Ct is a home located in Denton County with nearby schools including Monaco Elementary School, Aubrey Middle School, and Aubrey High School.
Ownership History
Date
Name
Owned For
Owner Type
Purchase Details
Closed on
Nov 25, 2014
Sold by
American Homes 4 Rent Properties Two Llc
Bought by
Amh 2014 3 Borrower Llc
Current Estimated Value
Purchase Details
Closed on
Jul 2, 2013
Sold by
Moore Larry Blake and Moore Kristen
Bought by
American Homes 4 Rent Properties Two Llc
Purchase Details
Closed on
Dec 29, 2010
Sold by
Hmh Lifestyles L P
Bought by
Moore Larry Blake
Home Financials for this Owner
Home Financials are based on the most recent Mortgage that was taken out on this home.
Original Mortgage
$136,735
Interest Rate
4.36%
Mortgage Type
New Conventional
Purchase Details
Closed on
Mar 15, 2010
Sold by
380 Lots Llc
Bought by
Hmh Lifestyles Lp
Home Financials for this Owner
Home Financials are based on the most recent Mortgage that was taken out on this home.
Original Mortgage
$108,000
Interest Rate
4.95%
Mortgage Type
Purchase Money Mortgage
Create a Home Valuation Report for This Property
The Home Valuation Report is an in-depth analysis detailing your home's value as well as a comparison with similar homes in the area
Home Values in the Area
Average Home Value in this Area
Purchase History
| Date | Buyer | Sale Price | Title Company |
|---|---|---|---|
| Amh 2014 3 Borrower Llc | -- | Excel Title Group | |
| American Homes 4 Rent Properties Two Llc | $120,701 | None Available | |
| Moore Larry Blake | -- | Stnt | |
| Hmh Lifestyles Lp | -- | Stnt |
Source: Public Records
Mortgage History
| Date | Status | Borrower | Loan Amount |
|---|---|---|---|
| Previous Owner | Moore Larry Blake | $136,735 | |
| Previous Owner | Hmh Lifestyles Lp | $108,000 |
Source: Public Records
Tax History Compared to Growth
Tax History
| Year | Tax Paid | Tax Assessment Tax Assessment Total Assessment is a certain percentage of the fair market value that is determined by local assessors to be the total taxable value of land and additions on the property. | Land | Improvement |
|---|---|---|---|---|
| 2024 | $5,838 | $303,658 | $68,362 | $235,296 |
| 2023 | $6,197 | $316,000 | $64,802 | $251,198 |
| 2022 | $6,358 | $281,023 | $61,038 | $219,985 |
| 2021 | $5,388 | $215,000 | $45,168 | $169,832 |
| 2020 | $5,678 | $220,000 | $45,168 | $174,832 |
| 2019 | $5,623 | $215,000 | $45,168 | $169,832 |
| 2018 | $5,266 | $204,000 | $45,168 | $158,832 |
| 2017 | $5,075 | $194,000 | $45,168 | $148,832 |
| 2016 | $4,369 | $167,000 | $36,623 | $130,377 |
| 2015 | -- | $155,000 | $30,662 | $124,338 |
| 2014 | -- | $120,701 | $30,662 | $90,039 |
| 2013 | -- | $144,000 | $30,662 | $113,338 |
Source: Public Records
Map
Nearby Homes
- 9108 Nathaniel Dr
- 9036 Greene Dr
- 9105 Waterman Dr
- 9140 Blackstone Dr
- 9321 Waterman Dr
- 9029 Huxley Dr
- 9028 Blackstone Dr
- 9161 Blackstone Dr
- 9157 Blackstone Dr
- 9145 Blackstone Dr
- 9173 Blackstone Dr
- 9329 Masse Ct
- 9109 Blackstone Dr
- 9230 Masse Ct
- 1901 Rodgers Ln
- 2217 Prospect Ln
- 9001 Gano Dr
- 1924 Stephanie Ct
- 9220 Blackstone Dr
- 1804 Dr Sanders Rd