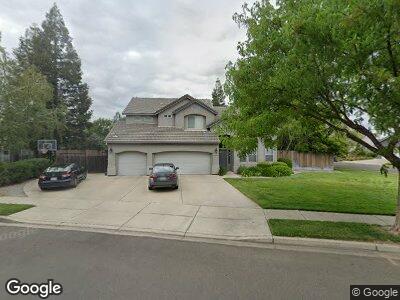
1925 Westminster Ln Turlock, CA 95382
Estimated Value: $684,000 - $738,198
4
Beds
3
Baths
2,315
Sq Ft
$310/Sq Ft
Est. Value
About This Home
This home is located at 1925 Westminster Ln, Turlock, CA 95382 and is currently estimated at $717,300, approximately $309 per square foot. 1925 Westminster Ln is a home located in Stanislaus County with nearby schools including Denair Elementary School, Denair Middle School, and Denair High School.
Ownership History
Date
Name
Owned For
Owner Type
Purchase Details
Closed on
Nov 23, 2011
Sold by
Nevarez Andres and Nevarez Toni J
Bought by
Nevarez Andres and Nevarez Toni J
Current Estimated Value
Home Financials for this Owner
Home Financials are based on the most recent Mortgage that was taken out on this home.
Original Mortgage
$174,000
Outstanding Balance
$123,146
Interest Rate
4.06%
Mortgage Type
New Conventional
Estimated Equity
$604,607
Purchase Details
Closed on
Apr 5, 2010
Sold by
Nevarez Andres and Nevarez Toni J
Bought by
Nevarez Andres and Nevarez Toni J
Purchase Details
Closed on
Apr 13, 1998
Sold by
Jkb Homes Corp
Bought by
Nevarez Andres and Nevarez Toni J
Home Financials for this Owner
Home Financials are based on the most recent Mortgage that was taken out on this home.
Original Mortgage
$187,850
Interest Rate
6.42%
Mortgage Type
Purchase Money Mortgage
Create a Home Valuation Report for This Property
The Home Valuation Report is an in-depth analysis detailing your home's value as well as a comparison with similar homes in the area
Home Values in the Area
Average Home Value in this Area
Purchase History
| Date | Buyer | Sale Price | Title Company |
|---|---|---|---|
| Nevarez Andres | -- | Accommodation | |
| Nevarez Andres | -- | Chicago Title Company | |
| Nevarez Andres | -- | None Available | |
| Nevarez Andres | -- | None Available | |
| Nevarez Andres | $221,500 | Fidelity National Title Co |
Source: Public Records
Mortgage History
| Date | Status | Borrower | Loan Amount |
|---|---|---|---|
| Open | Nevarez Andres | $174,000 | |
| Closed | Nevarez Andres | $228,000 | |
| Closed | Nevarez Andres | $40,636 | |
| Previous Owner | Nevarez Andres | $187,850 |
Source: Public Records
Tax History Compared to Growth
Tax History
| Year | Tax Paid | Tax Assessment Tax Assessment Total Assessment is a certain percentage of the fair market value that is determined by local assessors to be the total taxable value of land and additions on the property. | Land | Improvement |
|---|---|---|---|---|
| 2024 | $4,558 | $356,559 | $69,156 | $287,403 |
| 2023 | $4,439 | $349,568 | $67,800 | $281,768 |
| 2022 | $4,349 | $342,715 | $66,471 | $276,244 |
| 2021 | $4,285 | $335,996 | $65,168 | $270,828 |
| 2020 | $4,181 | $332,551 | $64,500 | $268,051 |
| 2019 | $3,960 | $326,032 | $63,236 | $262,796 |
| 2018 | $3,982 | $319,641 | $61,997 | $257,644 |
| 2017 | $3,848 | $313,375 | $60,782 | $252,593 |
| 2016 | $3,824 | $307,232 | $59,591 | $247,641 |
| 2015 | $3,647 | $302,618 | $58,696 | $243,922 |
| 2014 | $3,630 | $296,691 | $57,547 | $239,144 |
Source: Public Records
Map
Nearby Homes
- 1870 Erin Way
- 2305 Carmichael Way
- 2061 N Johnson Rd
- 1703 Edgewood Dr
- 1870 Smith Dr
- 1906 Peacock Dr
- 1365 Michael Way
- 1945 Foxtail Ct
- 2164 Rothbury Ct
- 2505 Franks Ct
- 1721 N Johnson Rd
- 2392 Roseborough Ct
- 1221 Akron Dr
- 2395 Alborough Ct
- 1240 Heathernoel Way
- 2001 Cumberland Dr
- 2775 Meadowbrook Ln
- 2791 E Tuolumne Rd
- 3500 Brookstone Dr
- 1380 Burman Dr