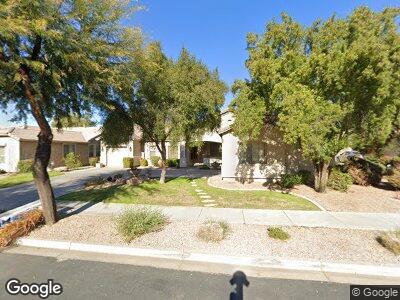
19340 E Thornton Rd Queen Creek, AZ 85142
Emperor Estates NeighborhoodEstimated Value: $575,000 - $639,000
--
Bed
4
Baths
2,501
Sq Ft
$240/Sq Ft
Est. Value
About This Home
This home is located at 19340 E Thornton Rd, Queen Creek, AZ 85142 and is currently estimated at $599,745, approximately $239 per square foot. 19340 E Thornton Rd is a home located in Maricopa County with nearby schools including Desert Mountain Elementary School, Queen Creek Middle School, and Benjamin Franklin Charter School - Power.
Ownership History
Date
Name
Owned For
Owner Type
Purchase Details
Closed on
Apr 4, 2017
Sold by
Nelson Oaul A and Nelson Rosalie R
Bought by
Dwyer Josh and Dwyer Rochelle
Current Estimated Value
Home Financials for this Owner
Home Financials are based on the most recent Mortgage that was taken out on this home.
Original Mortgage
$333,232
Interest Rate
4.14%
Mortgage Type
New Conventional
Purchase Details
Closed on
Jun 26, 2007
Sold by
Pulte Home Corp
Bought by
Nelson Paul A and Nelson Rosalie R
Home Financials for this Owner
Home Financials are based on the most recent Mortgage that was taken out on this home.
Original Mortgage
$255,992
Interest Rate
6.21%
Mortgage Type
New Conventional
Create a Home Valuation Report for This Property
The Home Valuation Report is an in-depth analysis detailing your home's value as well as a comparison with similar homes in the area
Home Values in the Area
Average Home Value in this Area
Purchase History
| Date | Buyer | Sale Price | Title Company |
|---|---|---|---|
| Dwyer Josh | $329,900 | Lawyers Title Of Arizona Inc | |
| Nelson Paul A | $319,990 | Sun Title Agency Co |
Source: Public Records
Mortgage History
| Date | Status | Borrower | Loan Amount |
|---|---|---|---|
| Open | Dwyer Josh | $424,590 | |
| Closed | Dwyer Josh | $324,807 | |
| Closed | Dwyer Josh | $333,232 | |
| Previous Owner | Nelson Paul A | $315,250 | |
| Previous Owner | Nelson Paul A | $330,000 | |
| Previous Owner | Nelson Paul A | $255,992 | |
| Previous Owner | Nelson Paul A | $47,998 | |
| Previous Owner | Nelson Paul A | $255,992 | |
| Previous Owner | Nelson Paul A | $47,998 |
Source: Public Records
Tax History Compared to Growth
Tax History
| Year | Tax Paid | Tax Assessment Tax Assessment Total Assessment is a certain percentage of the fair market value that is determined by local assessors to be the total taxable value of land and additions on the property. | Land | Improvement |
|---|---|---|---|---|
| 2025 | $2,427 | $26,490 | -- | -- |
| 2024 | $2,486 | $25,229 | -- | -- |
| 2023 | $2,486 | $46,180 | $9,230 | $36,950 |
| 2022 | $2,406 | $35,050 | $7,010 | $28,040 |
| 2021 | $2,465 | $31,800 | $6,360 | $25,440 |
| 2020 | $2,388 | $29,660 | $5,930 | $23,730 |
| 2019 | $2,364 | $27,180 | $5,430 | $21,750 |
| 2018 | $2,509 | $25,320 | $5,060 | $20,260 |
| 2017 | $2,401 | $23,520 | $4,700 | $18,820 |
| 2016 | $2,068 | $22,980 | $4,590 | $18,390 |
| 2015 | $1,956 | $21,250 | $4,250 | $17,000 |
Source: Public Records
Map
Nearby Homes
- 19351 E Apricot Ln
- 19323 E Canary Way
- 19359 E Canary Way
- 20017 S 192nd Place
- 20594 S 194th Place
- 19318 E Walnut Rd
- 19588 E Apricot Ln
- 19571 E Strawberry Dr
- 19668 E Carriage Way
- 19235 E Peartree Ln
- 19305 E Oriole Way
- 20725 S 191st Way
- 19162 E Mockingbird Dr
- 19861 S 191st St
- 19641 E Emperor Blvd
- 19011 E Carriage Way
- 19699 E Apricot Ln
- 19000 E Old Beau Trail
- 19741 E Reins Rd
- 19087 E Walnut Ct