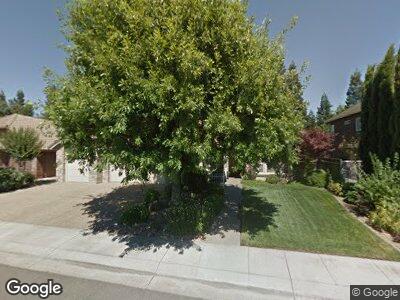
19418 Benedict Dr Woodbridge, CA 95258
Windwood NeighborhoodEstimated Value: $730,226 - $842,000
3
Beds
3
Baths
2,532
Sq Ft
$314/Sq Ft
Est. Value
About This Home
This home is located at 19418 Benedict Dr, Woodbridge, CA 95258 and is currently estimated at $796,057, approximately $314 per square foot. 19418 Benedict Dr is a home located in San Joaquin County with nearby schools including Vinewood Elementary School, Millswood Middle School, and Lodi High School.
Ownership History
Date
Name
Owned For
Owner Type
Purchase Details
Closed on
Apr 9, 2009
Sold by
Davis Clifford T and Davis Anna Marie
Bought by
Davis Clifford T and Davis Anna Marie
Current Estimated Value
Purchase Details
Closed on
Feb 11, 2002
Sold by
Statkus David Mark and Statkus Felicia Ann
Bought by
Davis Clifford T and Davis Anna Marie
Home Financials for this Owner
Home Financials are based on the most recent Mortgage that was taken out on this home.
Original Mortgage
$100,000
Interest Rate
7.13%
Purchase Details
Closed on
Sep 15, 1994
Sold by
Jjc Development Inc
Bought by
Statkus David Mark and Statkus Felicia Ann
Home Financials for this Owner
Home Financials are based on the most recent Mortgage that was taken out on this home.
Original Mortgage
$232,000
Interest Rate
8.78%
Create a Home Valuation Report for This Property
The Home Valuation Report is an in-depth analysis detailing your home's value as well as a comparison with similar homes in the area
Home Values in the Area
Average Home Value in this Area
Purchase History
| Date | Buyer | Sale Price | Title Company |
|---|---|---|---|
| Davis Clifford T | -- | None Available | |
| Davis Clifford T | -- | None Available | |
| Davis Clifford T | $350,000 | Central Valley Title Company | |
| Statkus David Mark | $258,000 | North American Title Company |
Source: Public Records
Mortgage History
| Date | Status | Borrower | Loan Amount |
|---|---|---|---|
| Closed | Davis Clifford T | $100,000 | |
| Previous Owner | Statkus David Mark | $232,000 | |
| Previous Owner | Statkus David Mark | $232,750 | |
| Previous Owner | Statkus David Mark | $232,000 |
Source: Public Records
Tax History Compared to Growth
Tax History
| Year | Tax Paid | Tax Assessment Tax Assessment Total Assessment is a certain percentage of the fair market value that is determined by local assessors to be the total taxable value of land and additions on the property. | Land | Improvement |
|---|---|---|---|---|
| 2024 | $6,713 | $506,887 | $152,064 | $354,823 |
| 2023 | $6,446 | $496,949 | $149,083 | $347,866 |
| 2022 | $6,246 | $487,206 | $146,160 | $341,046 |
| 2021 | $6,306 | $477,654 | $143,295 | $334,359 |
| 2020 | $5,844 | $472,757 | $141,826 | $330,931 |
| 2019 | $5,709 | $463,489 | $139,046 | $324,443 |
| 2018 | $5,632 | $454,402 | $136,320 | $318,082 |
| 2017 | $5,514 | $445,494 | $133,648 | $311,846 |
| 2016 | $5,176 | $436,761 | $131,028 | $305,733 |
| 2014 | $5,068 | $421,778 | $126,533 | $295,245 |
Source: Public Records
Map
Nearby Homes
- 19591 Meadow View Dr
- 19431 Fawn Dr
- 19215 N Augusta St
- 545 Vista Rio Ct
- 537 Kirst Dr
- 328 Indiana St
- 19200 Perryman Rd
- 19014 Pebble Run
- 1253 Inglewood Ct
- 2401 Eilers Ln Unit 903
- 2401 Eilers Ln Unit 401
- 2401 Eilers Ln Unit 902
- 2401 Eilers Ln Unit 805
- 2401 Eilers Ln Unit 505
- 1033 Bridgetowne Dr
- 2912 Cumbria Way
- 2400 Eilers Ln Unit 1708
- 19250 N Lower Sacramento Rd Unit 8
- 875 W Turner Rd
- 20540 N Davis Rd