
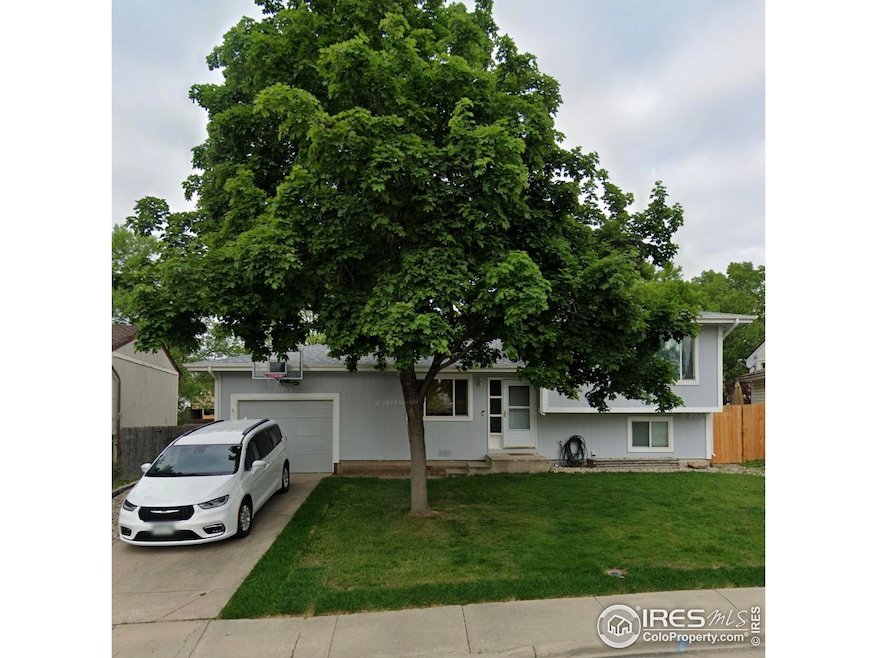
1943 Cindy Ct Loveland, CO 80537
4
Beds
2
Baths
1,230
Sq Ft
6,574
Sq Ft Lot
Highlights
- No HOA
- Eat-In Kitchen
- Kitchen Island
- 1 Car Attached Garage
- Double Pane Windows
- Forced Air Heating and Cooling System
About This Home
As of February 2025Sold before published.
Home Details
Home Type
- Single Family
Est. Annual Taxes
- $1,790
Year Built
- Built in 1979
Lot Details
- 6,574 Sq Ft Lot
- East Facing Home
- Wood Fence
- Level Lot
- Sprinkler System
- Property is zoned R1E
Parking
- 1 Car Attached Garage
Home Design
- Wood Frame Construction
- Composition Roof
- Wood Siding
Interior Spaces
- 1,230 Sq Ft Home
- 3-Story Property
- Ceiling Fan
- Double Pane Windows
- Laminate Flooring
- Natural lighting in basement
Kitchen
- Eat-In Kitchen
- Electric Oven or Range
- Dishwasher
- Kitchen Island
Bedrooms and Bathrooms
- 4 Bedrooms
- 2 Full Bathrooms
Laundry
- Laundry on lower level
- Dryer
- Washer
Outdoor Features
- Exterior Lighting
Schools
- Kitchen Elementary School
- Bill Reed Middle School
- Thompson Valley High School
Utilities
- Forced Air Heating and Cooling System
- High Speed Internet
- Cable TV Available
Community Details
- No Home Owners Association
- Sherri Mar Subdivision
Listing and Financial Details
- Assessor Parcel Number R0420433
Map
Create a Home Valuation Report for This Property
The Home Valuation Report is an in-depth analysis detailing your home's value as well as a comparison with similar homes in the area
Home Values in the Area
Average Home Value in this Area
Property History
| Date | Event | Price | Change | Sq Ft Price |
|---|---|---|---|---|
| 02/10/2025 02/10/25 | Sold | $367,000 | +0.3% | $298 / Sq Ft |
| 01/29/2025 01/29/25 | For Sale | $366,000 | +19.2% | $298 / Sq Ft |
| 11/05/2021 11/05/21 | Off Market | $307,000 | -- | -- |
| 08/07/2020 08/07/20 | Sold | $307,000 | 0.0% | $250 / Sq Ft |
| 07/29/2020 07/29/20 | Pending | -- | -- | -- |
| 06/27/2020 06/27/20 | Price Changed | $307,000 | -1.8% | $250 / Sq Ft |
| 06/22/2020 06/22/20 | For Sale | $312,500 | 0.0% | $254 / Sq Ft |
| 06/22/2020 06/22/20 | Price Changed | $312,500 | +1.8% | $254 / Sq Ft |
| 06/10/2020 06/10/20 | Off Market | $307,000 | -- | -- |
| 06/06/2020 06/06/20 | Price Changed | $310,000 | -2.4% | $252 / Sq Ft |
| 05/01/2020 05/01/20 | Price Changed | $317,500 | -2.3% | $258 / Sq Ft |
| 04/23/2020 04/23/20 | For Sale | $325,000 | +30.0% | $264 / Sq Ft |
| 01/28/2019 01/28/19 | Off Market | $250,000 | -- | -- |
| 09/12/2016 09/12/16 | Sold | $250,000 | +2.0% | $196 / Sq Ft |
| 08/13/2016 08/13/16 | Pending | -- | -- | -- |
| 07/12/2016 07/12/16 | For Sale | $245,000 | -- | $192 / Sq Ft |
Source: IRES MLS
Tax History
| Year | Tax Paid | Tax Assessment Tax Assessment Total Assessment is a certain percentage of the fair market value that is determined by local assessors to be the total taxable value of land and additions on the property. | Land | Improvement |
|---|---|---|---|---|
| 2025 | $1,727 | $26,124 | $1,367 | $24,757 |
| 2024 | $1,727 | $26,124 | $1,367 | $24,757 |
| 2022 | $1,605 | $20,169 | $1,418 | $18,751 |
| 2021 | $1,649 | $20,750 | $1,459 | $19,291 |
| 2020 | $1,540 | $19,370 | $1,459 | $17,911 |
| 2019 | $1,514 | $19,370 | $1,459 | $17,911 |
| 2018 | $1,320 | $16,035 | $1,469 | $14,566 |
| 2017 | $1,136 | $16,035 | $1,469 | $14,566 |
| 2016 | $1,028 | $14,018 | $1,624 | $12,394 |
| 2015 | $1,020 | $14,010 | $1,620 | $12,390 |
| 2014 | $840 | $11,170 | $1,620 | $9,550 |
Source: Public Records
Mortgage History
| Date | Status | Loan Amount | Loan Type |
|---|---|---|---|
| Open | $348,650 | New Conventional | |
| Previous Owner | $313,500 | New Conventional | |
| Previous Owner | $260,950 | New Conventional | |
| Previous Owner | $250,000 | New Conventional | |
| Previous Owner | $38,900 | Stand Alone Second | |
| Previous Owner | $31,400 | Stand Alone Second | |
| Previous Owner | $125,600 | No Value Available | |
| Previous Owner | $17,000 | Credit Line Revolving | |
| Previous Owner | $128,900 | Unknown | |
| Previous Owner | $100,000 | Unknown | |
| Previous Owner | $28,990 | Unknown | |
| Previous Owner | $23,021 | Unknown | |
| Previous Owner | $95,400 | No Value Available | |
| Previous Owner | $83,000 | Seller Take Back |
Source: Public Records
Deed History
| Date | Type | Sale Price | Title Company |
|---|---|---|---|
| Warranty Deed | $367,000 | None Listed On Document | |
| Warranty Deed | $307,000 | Fidelity National Title | |
| Warranty Deed | $250,000 | Fidelity National Title Ins | |
| Interfamily Deed Transfer | -- | -- | |
| Warranty Deed | $157,000 | Land Title Guarantee Company | |
| Warranty Deed | $106,000 | Land Title | |
| Individual Deed | $95,000 | -- |
Source: Public Records
Similar Homes in Loveland, CO
-
$415,000
- 3 Beds
- 2 Baths
- 1,688 Sq Ft
- 664 Cheryl Ct
- Loveland, CO
Tucked at the end of a peaceful cul-de-sac in the desirable Sherri-Mar neighborhood of Loveland, this multi-level home offers space, flexibility, and a backyard made for enjoying Colorado living. Step into the upper level and you're welcomed by a sunny living room that flows seamlessly into the dining area and kitchen. A door off the dining room provides access to the patio and attached 1-car
Matthew Purdy Redfin Corporation
-
$365,000
- 2 Beds
- 1.5 Baths
- 1,012 Sq Ft
- 1406 Effie Ct
- Loveland, CO
BACK ON THE MARKET, BUYERS HAD COLD FEET. Nestled in a quiet cul-de-sac, 1406 Effie Ct offers the perfect blend of comfort, style, and privacy. Rarely do homes in this neighborhood come on the market, making this a unique opportunity. Inside, you’ll find a beautifully updated interior with freshly painted bedrooms, creating a bright and inviting atmosphere. The kitchen shines with newly painted
Bret Brewer Distinct Real Estate LLC
-
$379,000
- 3 Beds
- 1 Bath
- 974 Sq Ft
- 135 S Jefferson Ave
- Loveland, CO
Seller may consider buyer concessions if made in an offer. Welcome to this beautifully maintained property that awaits your personal touch. Featuring a neutral color paint scheme, the interior has been freshly painted, creating a warm and inviting atmosphere. An accent backsplash that adds a touch of elegance. Partial flooring replacement has been done, ensuring the home is ready. Step outside
Tara Jones Opendoor Brokerage LLC
Source: IRES MLS
MLS Number: 1026172
APN: 95262-38-023
Disclaimer: Certain information contained herein is derived from information provided by parties other than Homes.com. All information provided is deemed reliable, but is not guaranteed to be accurate and should be independently verified.
![]() Information source: Information and Real Estate Services, LLC. Provided for limited non-commercial use only under IRES Rules © Copyright IRES.
Information source: Information and Real Estate Services, LLC. Provided for limited non-commercial use only under IRES Rules © Copyright IRES.
Listing information is provided exclusively for consumers' personal, non-commercial use and may not be used for any purpose other than to identify prospective properties consumers may be interested in purchasing.
Information deemed reliable but not guaranteed by the MLS.
Nearby Homes
- 664 Cheryl Ct
- 568 18th St SW
- 914 22nd St SW
- 0 SW 14th St Unit 949960
- 1687 Valency Dr
- 1673 Valency Dr
- 436 Primrose Ct
- 474 Primrose Ct
- 465 Primrose Ct
- 220 12th St SW Unit 125
- 2005 Frances Dr
- 1441 Glenda Ct
- 2112 Arron Dr
- 2420 Frances Dr
- 214 Sierra Vista Dr
- 253 Courtney Dr
- 1714 23rd St SW
- 1186 Lavender Ave
- 4001 S Garfield Ave
- 1157 Lavender Ave