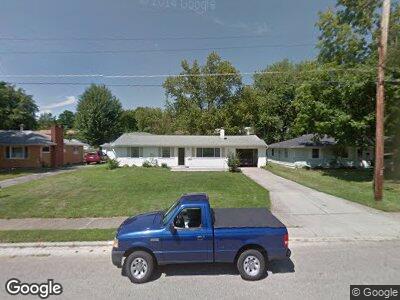
195 Kinkel Ave Mansfield, OH 44907
Estimated Value: $125,000 - $151,000
3
Beds
1
Bath
1,260
Sq Ft
$110/Sq Ft
Est. Value
About This Home
This home is located at 195 Kinkel Ave, Mansfield, OH 44907 and is currently estimated at $138,362, approximately $109 per square foot. 195 Kinkel Ave is a home located in Richland County with nearby schools including Madison High School, St. Peter's Elementary/Montessori School, and St. Peter's High School/Junior High.
Ownership History
Date
Name
Owned For
Owner Type
Purchase Details
Closed on
Mar 8, 2018
Sold by
Cline Ruth Ann and Cline Gerald L
Bought by
Cline Ruth Ann
Current Estimated Value
Purchase Details
Closed on
Jun 30, 2011
Sold by
Steward Eric J and Steward Alfreda
Bought by
Cline Gerald L and Cline Ruth Ann
Home Financials for this Owner
Home Financials are based on the most recent Mortgage that was taken out on this home.
Original Mortgage
$31,440
Interest Rate
4.56%
Mortgage Type
Seller Take Back
Purchase Details
Closed on
Jul 16, 2008
Sold by
Bank Of New York
Bought by
Steward Eric J and Steward Alfreda
Purchase Details
Closed on
Dec 17, 2007
Sold by
Zimmerman Carolyn K
Bought by
Bank Of New York and Certificateholders Of Alternative Loan T
Create a Home Valuation Report for This Property
The Home Valuation Report is an in-depth analysis detailing your home's value as well as a comparison with similar homes in the area
Home Values in the Area
Average Home Value in this Area
Purchase History
| Date | Buyer | Sale Price | Title Company |
|---|---|---|---|
| Cline Ruth Ann | -- | None Available | |
| Cline Gerald L | $31,450 | Attorney | |
| Steward Eric J | $50,000 | Resource Title Agency Inc | |
| Bank Of New York | $46,000 | None Available |
Source: Public Records
Mortgage History
| Date | Status | Borrower | Loan Amount |
|---|---|---|---|
| Open | Cline Ruth Ann | $80,382 | |
| Closed | Cline Ruth Ann | $50,000 | |
| Previous Owner | Cline Gerald L | $31,440 |
Source: Public Records
Tax History Compared to Growth
Tax History
| Year | Tax Paid | Tax Assessment Tax Assessment Total Assessment is a certain percentage of the fair market value that is determined by local assessors to be the total taxable value of land and additions on the property. | Land | Improvement |
|---|---|---|---|---|
| 2024 | $1,094 | $36,900 | $5,990 | $30,910 |
| 2023 | $1,094 | $36,900 | $5,990 | $30,910 |
| 2022 | $748 | $25,860 | $4,980 | $20,880 |
| 2021 | $748 | $25,860 | $4,980 | $20,880 |
| 2020 | $755 | $25,860 | $4,980 | $20,880 |
| 2019 | $644 | $21,920 | $4,220 | $17,700 |
| 2018 | $637 | $21,920 | $4,220 | $17,700 |
| 2017 | $624 | $21,920 | $4,220 | $17,700 |
| 2016 | $623 | $21,230 | $4,010 | $17,220 |
| 2015 | $623 | $21,230 | $4,010 | $17,220 |
| 2014 | $609 | $21,230 | $4,010 | $17,220 |
| 2012 | $311 | $22,340 | $4,220 | $18,120 |
Source: Public Records
Map
Nearby Homes
- 606 Woodville Rd
- 197 Malone Rd
- 844 Woodville Rd
- 417 Luther St
- 519 S Diamond St
- 61 Painter Ave
- 64 Winwood Dr
- 712 Wildwood Dr
- 0 W Cook Rd Unit 225001803
- 19 Gibson Ave
- 471 S Main St
- 58 W Raleigh Ave
- 388 Gem Ave
- 655 Gilbert Ave
- 129 Sunnyslope Dr Unit 6
- 89 W Cook Rd
- 51 Sunnyslope Dr
- 148 Dale Ave
- 358 Davidson St
- 248 Hedges St