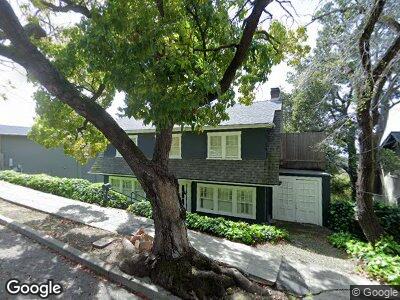
1986 Yosemite Rd Berkeley, CA 94707
Thousand Oaks NeighborhoodEstimated Value: $1,763,721 - $2,237,000
3
Beds
2
Baths
2,486
Sq Ft
$805/Sq Ft
Est. Value
About This Home
This home is located at 1986 Yosemite Rd, Berkeley, CA 94707 and is currently estimated at $2,001,680, approximately $805 per square foot. 1986 Yosemite Rd is a home located in Alameda County with nearby schools including Thousand Oaks Elementary School, Berkeley Arts Magnet at Whittier School, and Ruth Acty Elementary.
Ownership History
Date
Name
Owned For
Owner Type
Purchase Details
Closed on
Jul 15, 2010
Sold by
Yagura Robert Ken and Hackett Margo Beth
Bought by
Yagura Robert Ken and Hackett Margo Beth
Current Estimated Value
Purchase Details
Closed on
Jul 15, 2009
Sold by
Yagura Robert Ken and Hackett Margo Beth
Bought by
Yagura Robert Ken and Hackett Margo Beth
Home Financials for this Owner
Home Financials are based on the most recent Mortgage that was taken out on this home.
Original Mortgage
$268,500
Interest Rate
5.31%
Mortgage Type
Unknown
Purchase Details
Closed on
Jan 31, 2003
Sold by
Hackett Margo Beth and Yagura Robert Ken
Bought by
Yagura Robert Ken and Hackett Margo Beth
Home Financials for this Owner
Home Financials are based on the most recent Mortgage that was taken out on this home.
Original Mortgage
$291,000
Interest Rate
5.83%
Create a Home Valuation Report for This Property
The Home Valuation Report is an in-depth analysis detailing your home's value as well as a comparison with similar homes in the area
Home Values in the Area
Average Home Value in this Area
Purchase History
| Date | Buyer | Sale Price | Title Company |
|---|---|---|---|
| Yagura Robert Ken | -- | None Available | |
| Yagura Robert Ken | -- | Chicago Title Company | |
| Yagura Robert Ken | -- | Fidelity National Title Co |
Source: Public Records
Mortgage History
| Date | Status | Borrower | Loan Amount |
|---|---|---|---|
| Closed | Yagura Robert Ken | $300,000 | |
| Closed | Yagura Robert Ken | $268,500 | |
| Closed | Yagura Robert Ken | $291,000 | |
| Closed | Hackett Margo Beth | $240,000 |
Source: Public Records
Tax History Compared to Growth
Tax History
| Year | Tax Paid | Tax Assessment Tax Assessment Total Assessment is a certain percentage of the fair market value that is determined by local assessors to be the total taxable value of land and additions on the property. | Land | Improvement |
|---|---|---|---|---|
| 2024 | $9,857 | $390,315 | $292,693 | $104,622 |
| 2023 | $9,568 | $389,524 | $286,954 | $102,570 |
| 2022 | $9,482 | $374,889 | $281,329 | $100,560 |
| 2021 | $9,457 | $367,401 | $275,813 | $98,588 |
| 2020 | $8,837 | $370,562 | $272,985 | $97,577 |
| 2019 | $8,346 | $363,298 | $267,634 | $95,664 |
| 2018 | $8,141 | $356,176 | $262,387 | $93,789 |
| 2017 | $7,840 | $349,192 | $257,242 | $91,950 |
| 2016 | $7,462 | $342,346 | $252,199 | $90,147 |
| 2015 | $7,327 | $337,206 | $248,412 | $88,794 |
| 2014 | $7,159 | $330,602 | $243,547 | $87,055 |
Source: Public Records
Map
Nearby Homes
- 75 Southampton Ave
- 843 Arlington Ave
- 1869 San Ramon Ave
- 826 Indian Rock Ave
- 715 Santa Barbara Rd
- 1875 San Antonio Ave
- 635 Santa Barbara Rd
- 981 Indian Rock Ave
- 925 Modoc St
- 927 Santa Barbara Rd
- 614 Cragmont Ave
- 929 Spruce St
- 614 Peralta Ave
- 651 Neilson St
- 1640 Ocean View Ave
- 1632 Ocean View Ave
- 1130 Shattuck Ave
- 1656 Oak View Ave
- 561 Cragmont Ave
- 582 Euclid Ave