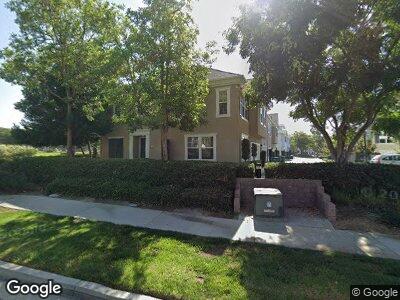
2 Ballard St Ladera Ranch, CA 92694
Township Village NeighborhoodEstimated Value: $923,000 - $1,058,000
3
Beds
3
Baths
1,762
Sq Ft
$567/Sq Ft
Est. Value
About This Home
This home is located at 2 Ballard St, Ladera Ranch, CA 92694 and is currently estimated at $999,473, approximately $567 per square foot. 2 Ballard St is a home located in Orange County with nearby schools including Chaparral Elementary School, Ladera Ranch Middle School, and Tesoro High School.
Ownership History
Date
Name
Owned For
Owner Type
Purchase Details
Closed on
Feb 8, 2016
Sold by
Arasoghli Flynn Nadine
Bought by
Flynn Damian
Current Estimated Value
Home Financials for this Owner
Home Financials are based on the most recent Mortgage that was taken out on this home.
Original Mortgage
$376,000
Interest Rate
3.98%
Mortgage Type
New Conventional
Purchase Details
Closed on
Aug 20, 2009
Sold by
Us Bank National Association
Bought by
Flynn Damian
Home Financials for this Owner
Home Financials are based on the most recent Mortgage that was taken out on this home.
Original Mortgage
$403,064
Interest Rate
5.18%
Mortgage Type
FHA
Purchase Details
Closed on
Jul 7, 2009
Sold by
Cook William J and Cook Joanne M
Bought by
Us Bank National Association
Home Financials for this Owner
Home Financials are based on the most recent Mortgage that was taken out on this home.
Original Mortgage
$403,064
Interest Rate
5.18%
Mortgage Type
FHA
Purchase Details
Closed on
Apr 1, 2009
Sold by
Cook William J
Bought by
Cook William J
Purchase Details
Closed on
Jun 9, 2004
Sold by
Walsh Freda
Bought by
Cook William J and Cook Joanne M
Home Financials for this Owner
Home Financials are based on the most recent Mortgage that was taken out on this home.
Original Mortgage
$406,000
Interest Rate
6.87%
Mortgage Type
Stand Alone First
Purchase Details
Closed on
Aug 5, 2003
Sold by
Walsh Freda
Bought by
Walsh Freda
Home Financials for this Owner
Home Financials are based on the most recent Mortgage that was taken out on this home.
Original Mortgage
$316,000
Interest Rate
4.12%
Mortgage Type
Purchase Money Mortgage
Purchase Details
Closed on
Jun 2, 2003
Sold by
Walsh John
Bought by
Walsh Freda
Purchase Details
Closed on
Mar 26, 2003
Sold by
Faubion Paul C and Faubion Susan L
Bought by
Walsh John and Walsh Freda
Home Financials for this Owner
Home Financials are based on the most recent Mortgage that was taken out on this home.
Original Mortgage
$316,000
Interest Rate
4.25%
Purchase Details
Closed on
May 16, 2002
Sold by
Faubion Paul C and Faubion Susan L
Bought by
Faubion Paul C and Faubion Susan L
Home Financials for this Owner
Home Financials are based on the most recent Mortgage that was taken out on this home.
Original Mortgage
$280,000
Interest Rate
4.87%
Purchase Details
Closed on
Apr 3, 2001
Sold by
Greystone Homes Inc
Bought by
Faubion Paul C and Faubion Susan L
Home Financials for this Owner
Home Financials are based on the most recent Mortgage that was taken out on this home.
Original Mortgage
$231,150
Interest Rate
7.09%
Create a Home Valuation Report for This Property
The Home Valuation Report is an in-depth analysis detailing your home's value as well as a comparison with similar homes in the area
Home Values in the Area
Average Home Value in this Area
Purchase History
| Date | Buyer | Sale Price | Title Company |
|---|---|---|---|
| Flynn Damian | -- | Servicelink | |
| Flynn Damian | $410,500 | Lsi Title Agency | |
| Us Bank National Association | $357,239 | None Available | |
| Cook William J | -- | None Available | |
| Cook William J | $600,000 | California Counties Title Co | |
| Walsh Freda | -- | Southland Title Corporation | |
| Walsh Freda | -- | -- | |
| Walsh John | $395,000 | North American Title Co | |
| Faubion Paul C | -- | Southland Title Corporation | |
| Faubion Paul C | $289,000 | North American Title Co |
Source: Public Records
Mortgage History
| Date | Status | Borrower | Loan Amount |
|---|---|---|---|
| Open | Flynn Damian | $325,000 | |
| Closed | Flynn Damian | $333,000 | |
| Closed | Flynn Damian | $376,000 | |
| Closed | Flynn Damian | $403,064 | |
| Previous Owner | Cook William J | $450,000 | |
| Previous Owner | Cook William J | $406,000 | |
| Previous Owner | Walsh Freda | $316,000 | |
| Previous Owner | Walsh John | $316,000 | |
| Previous Owner | Faubion Paul C | $280,000 | |
| Previous Owner | Faubion Paul C | $231,150 | |
| Closed | Faubion Paul C | $43,300 |
Source: Public Records
Tax History Compared to Growth
Tax History
| Year | Tax Paid | Tax Assessment Tax Assessment Total Assessment is a certain percentage of the fair market value that is determined by local assessors to be the total taxable value of land and additions on the property. | Land | Improvement |
|---|---|---|---|---|
| 2024 | $7,228 | $519,488 | $281,095 | $238,393 |
| 2023 | $7,123 | $509,302 | $275,583 | $233,719 |
| 2022 | $7,016 | $499,316 | $270,179 | $229,137 |
| 2021 | $6,918 | $489,526 | $264,881 | $224,645 |
| 2020 | $6,813 | $484,507 | $262,165 | $222,342 |
| 2019 | $6,850 | $475,007 | $257,024 | $217,983 |
| 2018 | $6,814 | $465,694 | $251,985 | $213,709 |
| 2017 | $6,871 | $456,563 | $247,044 | $209,519 |
| 2016 | $6,801 | $447,611 | $242,200 | $205,411 |
| 2015 | $6,859 | $440,888 | $238,562 | $202,326 |
| 2014 | $6,894 | $432,252 | $233,889 | $198,363 |
Source: Public Records
Map
Nearby Homes
- 6 Reston Way
- 31 Mercantile Way
- 6 Third St
- 9 Skywood St
- 23 Half Moon Trail
- 78 Three Vines Ct
- 5 Ash Hollow Trail Unit 97
- 36 Three Vines Ct Unit 2301
- 34 Three Vines Ct
- 59 Iron Horse Trail
- 18 Beacon Point
- 3 Bellflower St
- 46 Downing St
- 22 Snapdragon St
- 37 Walbert Ln
- 8 Potters Bend
- 66 Glenalmond Ln Unit 87
- 16 Aryshire Ln
- 49 Garrison Loop Unit 52
- 27 Garrison Loop