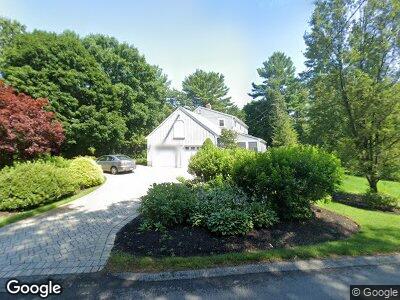
2 Dean St South Easton, MA 02375
Estimated Value: $807,000 - $1,148,000
4
Beds
3
Baths
2,684
Sq Ft
$342/Sq Ft
Est. Value
About This Home
This home is located at 2 Dean St, South Easton, MA 02375 and is currently estimated at $917,251, approximately $341 per square foot. 2 Dean St is a home located in Bristol County with nearby schools including Easton Middle School and Oliver Ames High School.
Ownership History
Date
Name
Owned For
Owner Type
Purchase Details
Closed on
May 5, 2016
Sold by
Wass & Donovan Ft
Bought by
Lowrie Jeffrey and Lowrie Carmenza H
Current Estimated Value
Home Financials for this Owner
Home Financials are based on the most recent Mortgage that was taken out on this home.
Original Mortgage
$399,000
Outstanding Balance
$322,385
Interest Rate
3.71%
Mortgage Type
New Conventional
Estimated Equity
$594,866
Purchase Details
Closed on
Aug 5, 2009
Sold by
Donovan Elizabeth A and Wass John A
Bought by
Donovan Tr Elizabeth A and Wass John A
Purchase Details
Closed on
May 14, 2008
Sold by
Kobs Ft
Bought by
Donovan Elizabeth A and Wass John A
Home Financials for this Owner
Home Financials are based on the most recent Mortgage that was taken out on this home.
Original Mortgage
$275,000
Interest Rate
5.91%
Mortgage Type
Purchase Money Mortgage
Create a Home Valuation Report for This Property
The Home Valuation Report is an in-depth analysis detailing your home's value as well as a comparison with similar homes in the area
Home Values in the Area
Average Home Value in this Area
Purchase History
| Date | Buyer | Sale Price | Title Company |
|---|---|---|---|
| Lowrie Jeffrey | $532,000 | -- | |
| Donovan Tr Elizabeth A | -- | -- | |
| Donovan Elizabeth A | $530,000 | -- |
Source: Public Records
Mortgage History
| Date | Status | Borrower | Loan Amount |
|---|---|---|---|
| Open | Lowrie Jeffrey | $399,000 | |
| Previous Owner | Wass Donovan Ft | $275,000 | |
| Previous Owner | Corbett Daniel L | $90,000 | |
| Previous Owner | Corbett Daniel L | $271,000 | |
| Previous Owner | Corbett Daniel L | $90,000 | |
| Previous Owner | Donovan Elizabeth A | $275,000 | |
| Previous Owner | Kobs Rt | $200,000 | |
| Previous Owner | Corbett Daniel L | $115,000 |
Source: Public Records
Tax History Compared to Growth
Tax History
| Year | Tax Paid | Tax Assessment Tax Assessment Total Assessment is a certain percentage of the fair market value that is determined by local assessors to be the total taxable value of land and additions on the property. | Land | Improvement |
|---|---|---|---|---|
| 2025 | $9,450 | $757,200 | $362,200 | $395,000 |
| 2024 | $9,392 | $703,500 | $309,300 | $394,200 |
| 2023 | $9,228 | $632,500 | $309,300 | $323,200 |
| 2022 | $8,960 | $582,200 | $267,800 | $314,400 |
| 2021 | $8,793 | $568,000 | $253,600 | $314,400 |
| 2020 | $8,407 | $546,600 | $243,900 | $302,700 |
| 2019 | $8,527 | $534,300 | $229,100 | $305,200 |
| 2018 | $8,347 | $514,900 | $229,100 | $285,800 |
| 2017 | $7,987 | $492,400 | $229,100 | $263,300 |
| 2016 | $7,771 | $480,000 | $229,100 | $250,900 |
| 2015 | $7,415 | $441,900 | $194,100 | $247,800 |
| 2014 | $7,316 | $439,400 | $188,500 | $250,900 |
Source: Public Records
Map
Nearby Homes
- 2 Dean St
- 217 Prospect St
- 186 Lincoln St
- 464 Bay Rd
- 12 Downing Dr
- 27 Concerto Ct
- 107 Howard St
- 91 Howard St
- 30 Rollins Rd
- 19 Forest Edge Rd
- 145 Burt St Unit 5
- 19 Tanglewood Dr
- 11 Highland St
- 4 Winnecunnet Dr
- O Leonard St
- 431 Depot St - L4 Overlook Ln
- 104 Norton Ave Unit 18
- 572 Foundry St
- 9 Erin Place
- 3 Bradford St