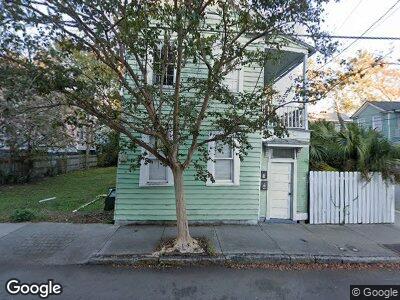
2 Hanover St Unit A Charleston, SC 29403
East Side NeighborhoodEstimated Value: $684,000 - $874,000
2
Beds
1
Bath
860
Sq Ft
$899/Sq Ft
Est. Value
About This Home
This home is located at 2 Hanover St Unit A, Charleston, SC 29403 and is currently estimated at $773,426, approximately $899 per square foot. 2 Hanover St Unit A is a home located in Charleston County with nearby schools including Memminger Elementary School, Simmons Pinckney Middle, and Burke High School.
Ownership History
Date
Name
Owned For
Owner Type
Purchase Details
Closed on
Jul 14, 2006
Sold by
Andover At Park West Assn Inc
Bought by
Park Island Development Inc
Current Estimated Value
Purchase Details
Closed on
Jun 21, 2006
Sold by
Warren Hamilton Llc
Bought by
Riggs David S
Purchase Details
Closed on
Sep 7, 2005
Sold by
Warren Joseph
Bought by
Warren Hamilton Llc
Purchase Details
Closed on
Aug 3, 2004
Sold by
Warren Hamilton Llc
Bought by
Warren Joseph
Purchase Details
Closed on
Apr 9, 2003
Sold by
Warren Joseph R
Bought by
Warren Hamilton Llc
Purchase Details
Closed on
Jun 8, 2000
Sold by
Blue Agnes Ethel
Bought by
Warren Joseph R
Purchase Details
Closed on
May 30, 2000
Sold by
Region Sibby Thompson and Thompson Luther
Bought by
Blue Agnes Ethel
Purchase Details
Closed on
May 26, 2000
Sold by
Thompson Pamela
Bought by
Blue Agnes Ethel
Purchase Details
Closed on
May 15, 2000
Sold by
Thompson Benjamin and Thompson Benjamin E
Bought by
Blue Agnes Ethel
Create a Home Valuation Report for This Property
The Home Valuation Report is an in-depth analysis detailing your home's value as well as a comparison with similar homes in the area
Home Values in the Area
Average Home Value in this Area
Purchase History
| Date | Buyer | Sale Price | Title Company |
|---|---|---|---|
| Park Island Development Inc | -- | None Available | |
| Riggs David S | $200,000 | None Available | |
| Warren Hamilton Llc | -- | -- | |
| Warren Joseph | -- | -- | |
| Warren Hamilton Llc | -- | -- | |
| Warren Joseph R | $70,000 | -- | |
| Blue Agnes Ethel | -- | -- | |
| Blue Agnes Ethel | -- | -- | |
| Blue Agnes Ethel | -- | -- |
Source: Public Records
Mortgage History
| Date | Status | Borrower | Loan Amount |
|---|---|---|---|
| Open | Riggs David S | $211,000 | |
| Closed | Riggs David D | $170,000 | |
| Closed | Riggs David S | $148,000 |
Source: Public Records
Tax History Compared to Growth
Tax History
| Year | Tax Paid | Tax Assessment Tax Assessment Total Assessment is a certain percentage of the fair market value that is determined by local assessors to be the total taxable value of land and additions on the property. | Land | Improvement |
|---|---|---|---|---|
| 2023 | $3,678 | $12,230 | $0 | $0 |
| 2022 | $3,370 | $12,230 | $0 | $0 |
| 2021 | $3,329 | $12,230 | $0 | $0 |
| 2020 | $3,306 | $12,230 | $0 | $0 |
| 2019 | $3,030 | $10,640 | $0 | $0 |
| 2017 | $2,899 | $10,640 | $0 | $0 |
| 2016 | $2,808 | $10,640 | $0 | $0 |
| 2015 | $2,684 | $10,640 | $0 | $0 |
| 2014 | $2,321 | $0 | $0 | $0 |
| 2011 | -- | $0 | $0 | $0 |
Source: Public Records
Map
Nearby Homes
- 2 Hanover St Unit A&B
- 22 1/2 Mary St Unit A,B,C
- 21 America St
- 53 America St
- 58 America St Unit A
- 17 Reid St
- 24 Hanover St
- 47 Drake St
- 3 Hampden Ct
- 12 John St Unit Includes 8 & 10
- 72 Drake St Unit B
- 72 Drake St Unit A
- 27 Chapel St
- 9 Iron Forge Alley
- 78 Nassau St
- 517 King St Unit 1
- 487 King St Unit 201
- 487 King St Unit 202 Penthouse
- 22 Iron Forge Alley
- 24 Iron Forge Alley