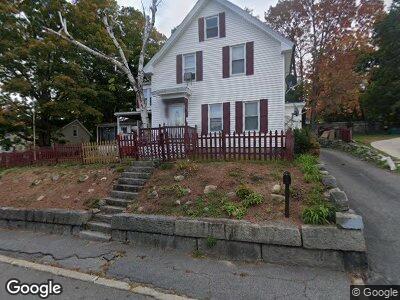
20 Forest St Fitchburg, MA 01420
Southside NeighborhoodEstimated Value: $402,607 - $449,000
3
Beds
2
Baths
2,858
Sq Ft
$150/Sq Ft
Est. Value
About This Home
This home is located at 20 Forest St, Fitchburg, MA 01420 and is currently estimated at $428,902, approximately $150 per square foot. 20 Forest St is a home located in Worcester County with nearby schools including South Street Elementary School, Reingold Elementary School, and Crocker Elementary School.
Ownership History
Date
Name
Owned For
Owner Type
Purchase Details
Closed on
Jul 30, 2024
Sold by
Torres Edna E
Bought by
Collazo-Torres Juan M
Current Estimated Value
Purchase Details
Closed on
Jun 4, 2010
Sold by
Fhlmc and Walsh
Bought by
Torres Edna E
Home Financials for this Owner
Home Financials are based on the most recent Mortgage that was taken out on this home.
Original Mortgage
$90,892
Interest Rate
5.12%
Mortgage Type
Purchase Money Mortgage
Purchase Details
Closed on
Jan 6, 2010
Sold by
Herne Mose A and Citimortgage Inc
Bought by
Fhlmc
Purchase Details
Closed on
Apr 2, 2001
Sold by
Niemi Michael A
Bought by
Stjean Annemarie and Herne Mose A
Purchase Details
Closed on
Jan 19, 1994
Sold by
Wilson Dorothy
Bought by
Niemi Michael A
Create a Home Valuation Report for This Property
The Home Valuation Report is an in-depth analysis detailing your home's value as well as a comparison with similar homes in the area
Home Values in the Area
Average Home Value in this Area
Purchase History
| Date | Buyer | Sale Price | Title Company |
|---|---|---|---|
| Collazo-Torres Juan M | -- | None Available | |
| Collazo-Torres Juan M | -- | None Available | |
| Torres Edna E | $85,500 | -- | |
| Fhlmc | $108,500 | -- | |
| Stjean Annemarie | $139,500 | -- | |
| Niemi Michael A | $32,000 | -- | |
| Torres Edna E | $85,500 | -- | |
| Fhlmc | $108,500 | -- | |
| Stjean Annemarie | $139,500 | -- | |
| Niemi Michael A | $32,000 | -- |
Source: Public Records
Mortgage History
| Date | Status | Borrower | Loan Amount |
|---|---|---|---|
| Previous Owner | Torres Edna E | $90,892 | |
| Previous Owner | Stjean Annemarie | $248,000 | |
| Previous Owner | Stjean Annemarie | $239,000 | |
| Previous Owner | Stjean Annemarie | $180,000 | |
| Previous Owner | Stjean Annemarie | $20,000 | |
| Previous Owner | Niemi Michael A | $15,667 |
Source: Public Records
Tax History Compared to Growth
Tax History
| Year | Tax Paid | Tax Assessment Tax Assessment Total Assessment is a certain percentage of the fair market value that is determined by local assessors to be the total taxable value of land and additions on the property. | Land | Improvement |
|---|---|---|---|---|
| 2025 | $50 | $370,700 | $87,000 | $283,700 |
| 2024 | $4,886 | $329,900 | $52,900 | $277,000 |
| 2023 | $4,620 | $288,400 | $40,600 | $247,800 |
| 2022 | $4,380 | $248,700 | $35,700 | $213,000 |
| 2021 | $4,091 | $215,000 | $27,100 | $187,900 |
| 2020 | $3,824 | $194,000 | $22,100 | $171,900 |
| 2019 | $3,430 | $167,400 | $30,800 | $136,600 |
| 2018 | $3,082 | $146,700 | $28,300 | $118,400 |
| 2017 | $2,850 | $132,600 | $25,800 | $106,800 |
| 2016 | $2,779 | $130,900 | $25,800 | $105,100 |
| 2015 | $2,721 | $131,600 | $27,100 | $104,500 |
| 2014 | $2,610 | $131,600 | $27,100 | $104,500 |
Source: Public Records
Map
Nearby Homes
- 21 Alston Place
- 76 Charles St
- 0 Kimball St & 14 Cleghorn St
- 219 Charles St
- 62 Payson St
- 28 Maple St
- 73-75 Nashua St
- 348 Rollstone St
- 77 Hazel St
- 10 Mountain Ave
- 9 Portland St
- 5-7 Washington St
- 28 Nashua St
- 89 Elizabeth St
- 74-76 Rainville Ave
- 44-46 Oliver St
- 49 Spruce St
- 70 Prichard St
- 29 Mount Vernon St
- 67 Day St