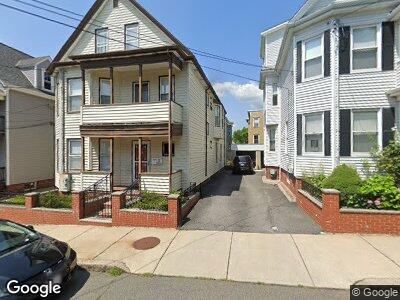
20 Gilman Terrace Somerville, MA 02145
Winter Hill NeighborhoodEstimated Value: $1,072,000 - $1,318,000
4
Beds
3
Baths
3,456
Sq Ft
$356/Sq Ft
Est. Value
About This Home
This home is located at 20 Gilman Terrace, Somerville, MA 02145 and is currently estimated at $1,231,444, approximately $356 per square foot. 20 Gilman Terrace is a home located in Middlesex County with nearby schools including Somerville High School, Prospect Hill Academy Upper Elementary Campus, and Bright Future Educare Center.
Ownership History
Date
Name
Owned For
Owner Type
Purchase Details
Closed on
Aug 26, 2015
Sold by
Serrao Egidio A and Sousa Diddia S
Bought by
20 Gilman Terrace Rt and Serrao Egidio A
Current Estimated Value
Home Financials for this Owner
Home Financials are based on the most recent Mortgage that was taken out on this home.
Original Mortgage
$60,000
Outstanding Balance
$25,898
Interest Rate
4%
Mortgage Type
Adjustable Rate Mortgage/ARM
Estimated Equity
$1,205,546
Purchase Details
Closed on
Mar 8, 2012
Sold by
Serrao Diddia and Serrao Jose
Bought by
Sousa Diddia S and Serrao Egidio A
Purchase Details
Closed on
Jun 29, 1987
Sold by
Santos Joao M
Bought by
Serrao Leonel G
Home Financials for this Owner
Home Financials are based on the most recent Mortgage that was taken out on this home.
Original Mortgage
$155,600
Interest Rate
10.5%
Mortgage Type
Purchase Money Mortgage
Create a Home Valuation Report for This Property
The Home Valuation Report is an in-depth analysis detailing your home's value as well as a comparison with similar homes in the area
Home Values in the Area
Average Home Value in this Area
Purchase History
| Date | Buyer | Sale Price | Title Company |
|---|---|---|---|
| 20 Gilman Terrace Rt | -- | -- | |
| Sousa Diddia S | -- | -- | |
| Serrao Leonel G | $194,500 | -- |
Source: Public Records
Mortgage History
| Date | Status | Borrower | Loan Amount |
|---|---|---|---|
| Open | 20 Gilman Terrace Rt | $60,000 | |
| Previous Owner | Serrao-Sousa Diddia | $69,000 | |
| Previous Owner | Hingston Diddia Serrao | $134,000 | |
| Previous Owner | Serrao Leonel G | $142,000 | |
| Previous Owner | Serrao Leonel G | $155,600 |
Source: Public Records
Tax History Compared to Growth
Tax History
| Year | Tax Paid | Tax Assessment Tax Assessment Total Assessment is a certain percentage of the fair market value that is determined by local assessors to be the total taxable value of land and additions on the property. | Land | Improvement |
|---|---|---|---|---|
| 2025 | $11,972 | $1,097,300 | $389,900 | $707,400 |
| 2024 | $11,410 | $1,084,600 | $389,900 | $694,700 |
| 2023 | $10,726 | $1,037,300 | $389,900 | $647,400 |
| 2022 | $10,113 | $993,400 | $371,300 | $622,100 |
| 2021 | $9,589 | $941,000 | $353,600 | $587,400 |
| 2020 | $9,006 | $892,600 | $340,000 | $552,600 |
| 2019 | $7,880 | $732,300 | $288,600 | $443,700 |
| 2018 | $7,292 | $644,700 | $278,400 | $366,300 |
| 2017 | $7,137 | $611,600 | $259,600 | $352,000 |
| 2016 | $6,829 | $545,000 | $224,500 | $320,500 |
| 2015 | $6,529 | $517,800 | $200,200 | $317,600 |
Source: Public Records
Map
Nearby Homes
- 81 Gilman St
- 28 Dana St Unit 1
- 28 Dana St Unit 2
- 297 Medford St
- 43 Bradley St
- 172 Pearl St
- 9 Pearl Street Place Unit 2
- 98 Flint St Unit 2
- 89 Flint St
- 148 Pearl St
- 12 Maple Ave Unit 1
- 25 Auburn Ave Unit 2
- 69 Walnut St
- 185 School St
- 62 Flint St Unit 64
- 26 Marshall St Unit 26
- 10 Cross Street Place Unit 3
- 8 Pleasant Ave
- 88 Cross St Unit 1
- 19 Cross St