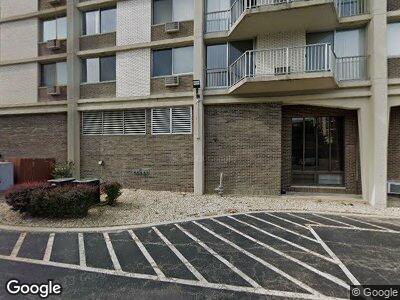
20 N Tower Rd Unit 4N Oak Brook, IL 60523
Oakbrook Terrace NeighborhoodEstimated Value: $222,144 - $237,000
2
Beds
2
Baths
1,284
Sq Ft
$177/Sq Ft
Est. Value
About This Home
This home is located at 20 N Tower Rd Unit 4N, Oak Brook, IL 60523 and is currently estimated at $227,786, approximately $177 per square foot. 20 N Tower Rd Unit 4N is a home located in DuPage County with nearby schools including Stevenson School, York Center Elementary School, and Jackson Middle School.
Ownership History
Date
Name
Owned For
Owner Type
Purchase Details
Closed on
Jan 10, 2023
Sold by
Mallela Parthasaradhi
Bought by
Parthasaradhi Mallela Living Trust
Current Estimated Value
Purchase Details
Closed on
Jun 1, 2005
Sold by
Reif Thomas J
Bought by
Mallela Parthasaradhi and Venkateson Padma
Purchase Details
Closed on
Dec 14, 2001
Sold by
Dodge Cherilyn J
Bought by
Reif Thomas J
Home Financials for this Owner
Home Financials are based on the most recent Mortgage that was taken out on this home.
Original Mortgage
$100,000
Interest Rate
7.07%
Mortgage Type
Purchase Money Mortgage
Purchase Details
Closed on
Feb 7, 2001
Sold by
Chan John and Wang Yu Fan
Bought by
Dodge Cherilyn J
Home Financials for this Owner
Home Financials are based on the most recent Mortgage that was taken out on this home.
Original Mortgage
$89,600
Interest Rate
7.1%
Mortgage Type
Purchase Money Mortgage
Purchase Details
Closed on
Jul 13, 1994
Sold by
Cohn Martin and Podesta Anthony T
Bought by
Chan John and Wang Yu Fan
Home Financials for this Owner
Home Financials are based on the most recent Mortgage that was taken out on this home.
Original Mortgage
$73,000
Interest Rate
7.37%
Mortgage Type
Purchase Money Mortgage
Create a Home Valuation Report for This Property
The Home Valuation Report is an in-depth analysis detailing your home's value as well as a comparison with similar homes in the area
Home Values in the Area
Average Home Value in this Area
Purchase History
| Date | Buyer | Sale Price | Title Company |
|---|---|---|---|
| Parthasaradhi Mallela Living Trust | -- | None Listed On Document | |
| Mallela Parthasaradhi | $172,500 | First American Title | |
| Reif Thomas J | $150,000 | -- | |
| Dodge Cherilyn J | $112,000 | Burnet Title Llc | |
| Chan John | $95,000 | -- |
Source: Public Records
Mortgage History
| Date | Status | Borrower | Loan Amount |
|---|---|---|---|
| Previous Owner | Reif Thomas J | $123,700 | |
| Previous Owner | Reif Thomas | $121,500 | |
| Previous Owner | Reif Thomas J | $100,000 | |
| Previous Owner | Dodge Cherilyn J | $89,600 | |
| Previous Owner | Chan John | $73,000 |
Source: Public Records
Tax History Compared to Growth
Tax History
| Year | Tax Paid | Tax Assessment Tax Assessment Total Assessment is a certain percentage of the fair market value that is determined by local assessors to be the total taxable value of land and additions on the property. | Land | Improvement |
|---|---|---|---|---|
| 2023 | $3,254 | $58,900 | $5,890 | $53,010 |
| 2022 | $3,012 | $51,600 | $5,160 | $46,440 |
| 2021 | $2,891 | $50,310 | $5,030 | $45,280 |
| 2020 | $2,817 | $49,210 | $4,920 | $44,290 |
| 2019 | $2,971 | $51,430 | $5,140 | $46,290 |
| 2018 | $2,537 | $43,700 | $4,370 | $39,330 |
| 2017 | $2,251 | $39,650 | $3,960 | $35,690 |
| 2016 | $2,194 | $37,350 | $3,730 | $33,620 |
| 2015 | $2,094 | $34,790 | $3,470 | $31,320 |
| 2014 | $2,183 | $35,590 | $3,550 | $32,040 |
| 2013 | $2,154 | $36,090 | $3,600 | $32,490 |
Source: Public Records
Map
Nearby Homes
- 20 N Tower Rd Unit 4F
- 20 N Tower Rd Unit 11D
- 20 N Tower Rd Unit 12M
- 20 N Tower Rd Unit 12F
- 27 N Tower Rd Unit 27
- 40 N Tower Rd Unit 8G
- 40 N Tower Rd Unit 5B
- 40 N Tower Rd Unit 14A
- 40 N Tower Rd Unit 5K
- 40 N Tower Rd Unit 5J
- 4 N Tower Rd Unit 4
- 1S702 School St
- 845 E 22nd St Unit B207
- 1601 Astor Ave Unit 20
- 19W040 22nd St
- 18W750 18th St
- 2 Royal Vale Dr
- 1600 S Meyers Rd
- 60 Baybrook Ln
- 2819 Meyers Rd