200 Meadow Dr Bridge City, TX 77611
East Orange NeighborhoodEstimated Value: $225,000 - $288,000
3
Beds
3
Baths
2,100
Sq Ft
$122/Sq Ft
Est. Value
About This Home
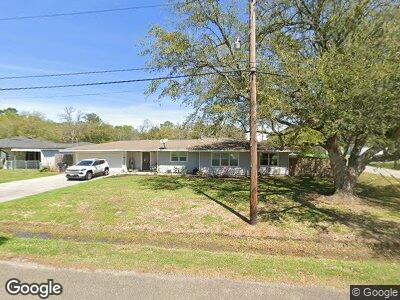
This home is located at 200 Meadow Dr, Bridge City, TX 77611 and is currently estimated at $255,187, approximately $121 per square foot. 200 Meadow Dr is a home located in Orange County with nearby schools including Bridge City Elementary School, Bridge City Intermediate School, and Bridge City Middle School.
Ownership History
Date
Name
Owned For
Owner Type
Purchase Details
Closed on
Sep 15, 2020
Sold by
Quebedeaux Johnny D and Quebedeaux Cindy L
Bought by
Null Allyson Jo
Current Estimated Value
Home Financials for this Owner
Home Financials are based on the most recent Mortgage that was taken out on this home.
Original Mortgage
$190,000
Outstanding Balance
$170,991
Interest Rate
2.8%
Mortgage Type
New Conventional
Estimated Equity
$84,196
Purchase Details
Closed on
Apr 17, 2018
Sold by
Tisdale Barbara R Hoffpauir
Bought by
Quebedeaux Johnny D and Quebedeaux Cindy L
Create a Home Valuation Report for This Property
The Home Valuation Report is an in-depth analysis detailing your home's value as well as a comparison with similar homes in the area
Home Values in the Area
Average Home Value in this Area
Purchase History
| Date | Buyer | Sale Price | Title Company |
|---|---|---|---|
| Null Allyson Jo | -- | Capital Title | |
| Quebedeaux Johnny D | -- | Capital Title |
Source: Public Records
Mortgage History
| Date | Status | Borrower | Loan Amount |
|---|---|---|---|
| Open | Null Allyson Jo | $190,000 |
Source: Public Records
Tax History Compared to Growth
Tax History
| Year | Tax Paid | Tax Assessment Tax Assessment Total Assessment is a certain percentage of the fair market value that is determined by local assessors to be the total taxable value of land and additions on the property. | Land | Improvement |
|---|---|---|---|---|
| 2024 | $4,874 | $220,115 | $36,005 | $184,110 |
| 2023 | $5,344 | $242,401 | $20,118 | $222,283 |
| 2022 | $4,082 | $219,758 | $20,118 | $199,640 |
| 2021 | $4,669 | $196,828 | $20,118 | $176,710 |
| 2020 | $3,289 | $135,148 | $20,118 | $115,030 |
| 2019 | $3,253 | $130,232 | $20,118 | $110,114 |
| 2018 | $3,060 | $124,878 | $20,118 | $104,760 |
| 2017 | $596 | $124,878 | $20,118 | $104,760 |
| 2016 | $2,887 | $117,234 | $20,118 | $97,116 |
| 2015 | $682 | $118,881 | $20,118 | $98,763 |
| 2014 | $682 | $119,697 | $20,118 | $99,579 |
Source: Public Records
Map
Nearby Homes
- 895 Morning Glory Dr
- 1457 Elizabeth Stone Dr
- 1452 Elizabeth Stone Dr
- 150 Canal St
- 265 Franklin St Unit NO SHOWING TIME
- 2370 Granger Dr
- 2390 Granger Dr
- 2375 Texas Ave
- 275 Farm Dr
- 224 Parkside Dr
- 114 Robin Ave
- 605 Alexandria Ln
- 170 Bailey Ave
- 245 N Clover St
- 245 E Clover Dr
- 250 Lamesa Dr
- 004 Dove Ct
- 285 E Darby St
- 275 E Clover Dr
- 1274 Bourbon St