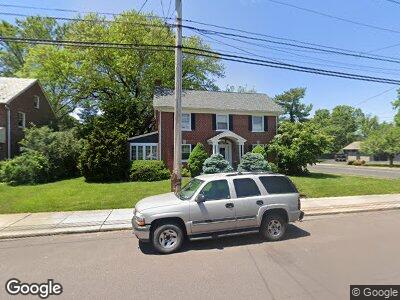
200 S 11th St Quakertown, PA 18951
Estimated Value: $339,000 - $411,000
3
Beds
2
Baths
1,938
Sq Ft
$195/Sq Ft
Est. Value
About This Home
This home is located at 200 S 11th St, Quakertown, PA 18951 and is currently estimated at $378,046, approximately $195 per square foot. 200 S 11th St is a home located in Bucks County with nearby schools including Quakertown Elementary School, Strayer Middle School, and Quakertown Community Senior High School.
Ownership History
Date
Name
Owned For
Owner Type
Purchase Details
Closed on
Mar 6, 2017
Sold by
Grote Austin S and Delillio Andrea M
Bought by
Grote Austin S and Grote Andrea M
Current Estimated Value
Home Financials for this Owner
Home Financials are based on the most recent Mortgage that was taken out on this home.
Original Mortgage
$213,050
Outstanding Balance
$119,234
Interest Rate
4.1%
Mortgage Type
New Conventional
Estimated Equity
$300,470
Purchase Details
Closed on
Jun 24, 2011
Sold by
Mccurry James D and Mccurry Nancy M
Bought by
Grote Austin S and Delillio Andrea M
Home Financials for this Owner
Home Financials are based on the most recent Mortgage that was taken out on this home.
Original Mortgage
$255,358
Interest Rate
4.6%
Mortgage Type
FHA
Purchase Details
Closed on
Dec 15, 1992
Bought by
Mccurry James D and Mccurry Nancy M
Create a Home Valuation Report for This Property
The Home Valuation Report is an in-depth analysis detailing your home's value as well as a comparison with similar homes in the area
Home Values in the Area
Average Home Value in this Area
Purchase History
| Date | Buyer | Sale Price | Title Company |
|---|---|---|---|
| Grote Austin S | -- | None Available | |
| Grote Austin S | $262,000 | None Available | |
| Mccurry James D | -- | -- |
Source: Public Records
Mortgage History
| Date | Status | Borrower | Loan Amount |
|---|---|---|---|
| Open | Grote Austin S | $213,050 | |
| Closed | Grote Austin S | $255,358 | |
| Previous Owner | Mccurry Nancy M | $15,000 | |
| Previous Owner | Mccurry James D | $20,000 |
Source: Public Records
Tax History Compared to Growth
Tax History
| Year | Tax Paid | Tax Assessment Tax Assessment Total Assessment is a certain percentage of the fair market value that is determined by local assessors to be the total taxable value of land and additions on the property. | Land | Improvement |
|---|---|---|---|---|
| 2024 | $5,378 | $26,720 | $5,560 | $21,160 |
| 2023 | $5,325 | $26,720 | $5,560 | $21,160 |
| 2022 | $5,235 | $26,720 | $5,560 | $21,160 |
| 2021 | $5,235 | $26,720 | $5,560 | $21,160 |
| 2020 | $5,235 | $26,720 | $5,560 | $21,160 |
| 2019 | $5,089 | $26,720 | $5,560 | $21,160 |
| 2018 | $4,912 | $26,720 | $5,560 | $21,160 |
| 2017 | $4,760 | $26,720 | $5,560 | $21,160 |
| 2016 | $4,760 | $26,720 | $5,560 | $21,160 |
| 2015 | -- | $26,720 | $5,560 | $21,160 |
| 2014 | -- | $26,720 | $5,560 | $21,160 |
Source: Public Records
Map
Nearby Homes
- 219 S 11th St
- 1485 Mohr St Unit PA RT 309
- 114 Braithwaite Ln
- 0 John St
- 131 Hickory Dr
- 215 Mill Rd
- 21 Muhlenberg Cir
- 22 Fairway Ct
- 71 Fairway Ct
- 197 Crocus Ct
- 713 Waterway Ct
- 12 Stonegate Village
- 1034 Freedom Ct
- 164 Forsythia Ct
- 237 Windsor Ct
- 124 Stonegate Village
- 410 Station Rd
- 211 Court Alley
- 24 Mimosa Ct
- 365 California Rd