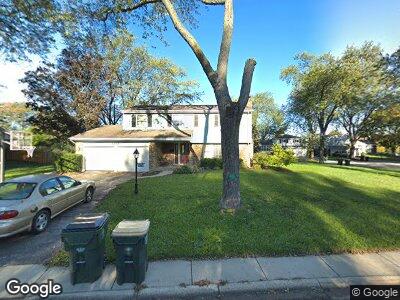
2002 N Evergreen Terrace Arlington Heights, IL 60004
Harris Prospect Park NeighborhoodEstimated Value: $527,358 - $558,000
4
Beds
3
Baths
1,993
Sq Ft
$272/Sq Ft
Est. Value
About This Home
This home is located at 2002 N Evergreen Terrace, Arlington Heights, IL 60004 and is currently estimated at $541,840, approximately $271 per square foot. 2002 N Evergreen Terrace is a home located in Cook County with nearby schools including Dwight D Eisenhower Elementary School, Anne Sullivan Elementary School, and Betsy Ross Elementary School.
Ownership History
Date
Name
Owned For
Owner Type
Purchase Details
Closed on
Feb 27, 2003
Sold by
Reno Charles V
Bought by
Reno Charles V and Reno Melanie
Current Estimated Value
Purchase Details
Closed on
Oct 9, 1998
Sold by
Reno Charles V and Reno Melanie K
Bought by
Reno Charles V
Home Financials for this Owner
Home Financials are based on the most recent Mortgage that was taken out on this home.
Original Mortgage
$214,500
Interest Rate
6.72%
Purchase Details
Closed on
Oct 30, 1995
Sold by
Sabatello Gregory D and Sabatello Nancy E
Bought by
Reno Charles V and Reno Melanie K
Home Financials for this Owner
Home Financials are based on the most recent Mortgage that was taken out on this home.
Original Mortgage
$210,000
Interest Rate
7.12%
Create a Home Valuation Report for This Property
The Home Valuation Report is an in-depth analysis detailing your home's value as well as a comparison with similar homes in the area
Home Values in the Area
Average Home Value in this Area
Purchase History
| Date | Buyer | Sale Price | Title Company |
|---|---|---|---|
| Reno Charles V | -- | -- | |
| Reno Charles V | -- | -- | |
| Reno Charles V | $345,000 | First American Title |
Source: Public Records
Mortgage History
| Date | Status | Borrower | Loan Amount |
|---|---|---|---|
| Open | Reno Charles | $374,000 | |
| Closed | Reno Charles | $62,500 | |
| Closed | Reno Charles | $292,000 | |
| Closed | Reno Charles | $70,000 | |
| Closed | Revo Charles R | $50,000 | |
| Closed | Reno Charles | $25,000 | |
| Closed | Reno Charles V | $214,500 | |
| Closed | Reno Charles V | $210,000 |
Source: Public Records
Tax History Compared to Growth
Tax History
| Year | Tax Paid | Tax Assessment Tax Assessment Total Assessment is a certain percentage of the fair market value that is determined by local assessors to be the total taxable value of land and additions on the property. | Land | Improvement |
|---|---|---|---|---|
| 2024 | $9,387 | $39,386 | $9,680 | $29,706 |
| 2023 | $9,387 | $39,386 | $9,680 | $29,706 |
| 2022 | $9,387 | $39,386 | $9,680 | $29,706 |
| 2021 | $8,590 | $31,592 | $5,500 | $26,092 |
| 2020 | $8,429 | $31,592 | $5,500 | $26,092 |
| 2019 | $8,857 | $36,916 | $5,500 | $31,416 |
| 2018 | $11,047 | $41,376 | $4,840 | $36,536 |
| 2017 | $10,949 | $41,376 | $4,840 | $36,536 |
| 2016 | $10,435 | $41,376 | $4,840 | $36,536 |
| 2015 | $9,581 | $34,861 | $4,180 | $30,681 |
| 2014 | $9,471 | $34,861 | $4,180 | $30,681 |
| 2013 | $9,241 | $34,861 | $4,180 | $30,681 |
Source: Public Records
Map
Nearby Homes
- 1524 E Arbor Ln
- 2048 N Evergreen Terrace
- 1838 N Windsor Dr
- 2111 N Brighton Place
- 1535 E Jane Ave
- 1628 N Windsor Dr
- 1649 N Courtland Dr Unit 171649
- 2425 N Windsor Dr
- 2466 E Towne Blvd Unit 164
- 814 E Crabtree Dr Unit 6
- 1952 N Charter Point Dr Unit 26
- 2407 E Sherwood Rd
- 2557 E Hunter Dr Unit 24
- 2114 E Peachtree Ln
- 1830 N Dale Ave
- 1825 E Suffield Dr
- 1949 N Charter Point Dr Unit 37
- 2118 N Lake Shore Cir
- 2128 N Lake Shore Cir
- 1907 N Stillwater Rd Unit 185