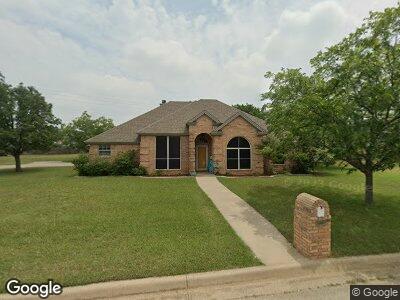
2005 S Falcon Dr Decatur, TX 76234
Decatur NeighborhoodEstimated Value: $353,621 - $402,000
3
Beds
2
Baths
1,862
Sq Ft
$205/Sq Ft
Est. Value
About This Home
This home is located at 2005 S Falcon Dr, Decatur, TX 76234 and is currently estimated at $382,405, approximately $205 per square foot. 2005 S Falcon Dr is a home located in Wise County with nearby schools including Decatur High School and Victory Christian Academy.
Ownership History
Date
Name
Owned For
Owner Type
Purchase Details
Closed on
Apr 5, 2016
Sold by
Lovett Danny Gene and Lovett Connie G
Bought by
Jones Julie Riley
Current Estimated Value
Home Financials for this Owner
Home Financials are based on the most recent Mortgage that was taken out on this home.
Original Mortgage
$110,000
Interest Rate
3.62%
Mortgage Type
Purchase Money Mortgage
Purchase Details
Closed on
Jun 16, 2014
Sold by
Pigg Jackie D and Pigg Jonna
Bought by
Lovett Carl E and Lovett Lahoma J
Purchase Details
Closed on
Dec 19, 2011
Sold by
Loudermilk Zelma
Bought by
Pigg Jackie D and Pigg Jonna
Purchase Details
Closed on
Feb 11, 2003
Sold by
Cendant Mobility Services Divi
Bought by
Jones Julie Riley
Purchase Details
Closed on
Jan 10, 2003
Sold by
Johnson Jason and Johnson Shelly
Bought by
Jones Julie Riley
Purchase Details
Closed on
May 2, 2001
Sold by
Hucklebridge Allan Lee and Hucklebridge Kelle
Bought by
Jones Julie Riley
Purchase Details
Closed on
Jan 27, 1999
Bought by
Jones Julie Riley
Create a Home Valuation Report for This Property
The Home Valuation Report is an in-depth analysis detailing your home's value as well as a comparison with similar homes in the area
Home Values in the Area
Average Home Value in this Area
Purchase History
| Date | Buyer | Sale Price | Title Company |
|---|---|---|---|
| Jones Julie Riley | -- | None Available | |
| Lovett Carl E | -- | None Available | |
| Pigg Jackie D | -- | -- | |
| Jones Julie Riley | -- | -- | |
| Jones Julie Riley | -- | -- | |
| Jones Julie Riley | -- | -- | |
| Jones Julie Riley | -- | -- | |
| Jones Julie Riley | -- | -- |
Source: Public Records
Mortgage History
| Date | Status | Borrower | Loan Amount |
|---|---|---|---|
| Closed | Jones Julie Riley | $110,000 |
Source: Public Records
Tax History Compared to Growth
Tax History
| Year | Tax Paid | Tax Assessment Tax Assessment Total Assessment is a certain percentage of the fair market value that is determined by local assessors to be the total taxable value of land and additions on the property. | Land | Improvement |
|---|---|---|---|---|
| 2024 | $3,404 | $352,740 | $59,424 | $293,316 |
| 2023 | $5,879 | $324,115 | $0 | $0 |
| 2022 | $6,453 | $294,650 | $0 | $0 |
| 2021 | $6,113 | $267,860 | $59,420 | $208,440 |
| 2020 | $6,035 | $257,280 | $59,420 | $197,860 |
| 2019 | $6,053 | $255,290 | $59,420 | $195,870 |
| 2018 | $5,740 | $222,010 | $31,740 | $190,270 |
| 2017 | $5,427 | $209,080 | $31,740 | $177,340 |
| 2016 | $4,897 | $188,660 | $31,740 | $156,920 |
| 2015 | -- | $178,990 | $31,740 | $147,250 |
| 2014 | -- | $162,500 | $31,740 | $130,760 |
Source: Public Records
Map
Nearby Homes
- 1500 Thousand Oaks Dr
- 1617 Thousand Oaks Dr
- 2606 S Lipsey St
- 1396 Hidden Springs Rd
- 216 El Dorado St
- 1420 Briar Crossing Dr
- 1317 Rodden Dr
- 1300 S Trenchard St
- 3202 S Fm 51
- 907 S Trenchard St
- 904 S Perrin St
- 3301 S Murvil St
- 218 Fairview Ct
- 1101 S Trinity St
- 1200 S Church St
- 249 E Walker St
- 401 Circle Dr
- 1707 Oakmeadow Dr
- 1202 S Hatcher St
- 3500 S Murvil St