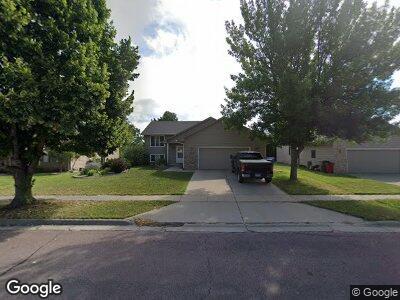
2008 S Alpine Ave Sioux Falls, SD 57110
Estimated Value: $273,000 - $357,000
4
Beds
3
Baths
2,245
Sq Ft
$147/Sq Ft
Est. Value
About This Home
This home is located at 2008 S Alpine Ave, Sioux Falls, SD 57110 and is currently estimated at $330,006, approximately $146 per square foot. 2008 S Alpine Ave is a home located in Minnehaha County with nearby schools including Rosa Parks Elementary School, Washington High School, and Sioux Falls Christian Elementary School.
Ownership History
Date
Name
Owned For
Owner Type
Purchase Details
Closed on
Aug 19, 2022
Sold by
Johnson Kassandra
Bought by
Lomax Tunis and Lomax Cynthia
Current Estimated Value
Home Financials for this Owner
Home Financials are based on the most recent Mortgage that was taken out on this home.
Original Mortgage
$320,100
Outstanding Balance
$308,539
Interest Rate
5.54%
Estimated Equity
$21,467
Purchase Details
Closed on
Feb 19, 2019
Sold by
Sehr Stacen and Sehr Emilee
Bought by
Johnson Kassandra
Home Financials for this Owner
Home Financials are based on the most recent Mortgage that was taken out on this home.
Original Mortgage
$226,495
Interest Rate
4.4%
Mortgage Type
New Conventional
Purchase Details
Closed on
Apr 30, 2013
Sold by
Secretary Of Housing And Urban Developme
Bought by
Sehr Stacen
Home Financials for this Owner
Home Financials are based on the most recent Mortgage that was taken out on this home.
Original Mortgage
$161,348
Interest Rate
3.25%
Mortgage Type
FHA
Create a Home Valuation Report for This Property
The Home Valuation Report is an in-depth analysis detailing your home's value as well as a comparison with similar homes in the area
Home Values in the Area
Average Home Value in this Area
Purchase History
| Date | Buyer | Sale Price | Title Company |
|---|---|---|---|
| Lomax Tunis | $330,000 | -- | |
| Lomax Tunis | $330,000 | -- | |
| Johnson Kassandra | $233,500 | None Available | |
| Sehr Stacen | -- | -- |
Source: Public Records
Mortgage History
| Date | Status | Borrower | Loan Amount |
|---|---|---|---|
| Open | Lomax Tunis | $320,100 | |
| Closed | Lomax Tunis | $320,100 | |
| Previous Owner | Johnson Kassandra | $227,000 | |
| Previous Owner | Johnson Kassandra | $226,495 | |
| Previous Owner | Sehr Stacen | $161,348 |
Source: Public Records
Tax History Compared to Growth
Tax History
| Year | Tax Paid | Tax Assessment Tax Assessment Total Assessment is a certain percentage of the fair market value that is determined by local assessors to be the total taxable value of land and additions on the property. | Land | Improvement |
|---|---|---|---|---|
| 2024 | $4,268 | $315,300 | $32,600 | $282,700 |
| 2023 | $4,149 | $295,000 | $32,600 | $262,400 |
| 2022 | $3,688 | $246,600 | $32,600 | $214,000 |
| 2021 | $3,409 | $222,900 | $0 | $0 |
| 2020 | $3,409 | $218,700 | $0 | $0 |
| 2019 | $3,169 | $199,312 | $0 | $0 |
| 2018 | $2,804 | $189,068 | $0 | $0 |
| 2017 | $2,760 | $176,678 | $28,512 | $148,166 |
| 2016 | $2,760 | $174,055 | $28,512 | $145,543 |
| 2015 | $2,695 | $163,293 | $26,928 | $136,365 |
| 2014 | -- | $147,857 | $27,209 | $120,648 |
Source: Public Records
Map
Nearby Homes
- 4805 E Fernwood Dr
- 4916 E Fernwood Dr
- 4920 E Fernwood Dr
- 4900 E Cattail Dr
- 4908 E Cattail Dr
- 2508 S Alpine Ave
- 5107 E Cattail Dr
- 2112 Saddle Ridge Dr
- 2405 S Red Oak Ave
- 2317 S Red Oak Ave
- 2013 S Red Oak Ave
- 2101 S Red Oak Ave
- 1807 S Daylight Dr
- 2105 S Red Oak Ave
- 1809 S Daylight Dr
- 2201 S Red Oak Ave
- 2205 S Red Oak Ave
- 2108 S Red Oak Ave
- 2305 S Red Oak Ave
- 1819 S Daylight Dr