203 Locksley Dr Greenwood, SC 29649
Estimated Value: $239,000 - $338,000
4
Beds
2
Baths
2,300
Sq Ft
$118/Sq Ft
Est. Value
About This Home
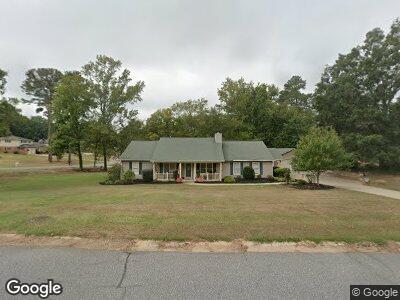
This home is located at 203 Locksley Dr, Greenwood, SC 29649 and is currently estimated at $271,932, approximately $118 per square foot. 203 Locksley Dr is a home located in Greenwood County with nearby schools including Merrywood Elementary School, Northside Middle School, and Greenwood High School.
Ownership History
Date
Name
Owned For
Owner Type
Purchase Details
Closed on
Mar 1, 2013
Sold by
Federal Home Loan Mortgage Corporation
Bought by
Gilchrist Terry D and Gilchrist Alice Harmon
Current Estimated Value
Home Financials for this Owner
Home Financials are based on the most recent Mortgage that was taken out on this home.
Original Mortgage
$111,920
Outstanding Balance
$80,398
Interest Rate
3.56%
Mortgage Type
New Conventional
Estimated Equity
$194,374
Purchase Details
Closed on
Aug 15, 2012
Sold by
Johnson James and Wells Fargo Bank Na
Bought by
Federal Home Loan Mortgage Corporation
Purchase Details
Closed on
Nov 30, 2006
Sold by
Ouzts Wanda
Bought by
Johnson James E and Johnson Betty R
Home Financials for this Owner
Home Financials are based on the most recent Mortgage that was taken out on this home.
Original Mortgage
$111,600
Interest Rate
6.36%
Mortgage Type
New Conventional
Create a Home Valuation Report for This Property
The Home Valuation Report is an in-depth analysis detailing your home's value as well as a comparison with similar homes in the area
Home Values in the Area
Average Home Value in this Area
Purchase History
| Date | Buyer | Sale Price | Title Company |
|---|---|---|---|
| Gilchrist Terry D | -- | -- | |
| Federal Home Loan Mortgage Corporation | -- | -- | |
| Johnson James E | $139,500 | -- |
Source: Public Records
Mortgage History
| Date | Status | Borrower | Loan Amount |
|---|---|---|---|
| Open | Gilchrist Terry D | $18,500 | |
| Open | Gilchrist Terry D | $111,920 | |
| Previous Owner | Johnson James E | $111,600 |
Source: Public Records
Tax History Compared to Growth
Tax History
| Year | Tax Paid | Tax Assessment Tax Assessment Total Assessment is a certain percentage of the fair market value that is determined by local assessors to be the total taxable value of land and additions on the property. | Land | Improvement |
|---|---|---|---|---|
| 2024 | $1,150 | $5,920 | $0 | $0 |
| 2023 | $1,150 | $5,920 | $0 | $0 |
| 2022 | $1,072 | $5,920 | $0 | $0 |
| 2021 | $1,055 | $5,920 | $0 | $0 |
| 2020 | $1,175 | $5,640 | $0 | $0 |
| 2019 | $1,160 | $5,640 | $0 | $0 |
| 2018 | $1,146 | $141,000 | $24,000 | $117,000 |
| 2017 | $1,134 | $141,000 | $24,000 | $117,000 |
| 2016 | $1,132 | $141,000 | $24,000 | $117,000 |
| 2015 | $1,134 | $143,900 | $24,000 | $119,900 |
| 2014 | $1,029 | $5,760 | $0 | $0 |
| 2010 | -- | $137,800 | $17,300 | $120,500 |
Source: Public Records
Map
Nearby Homes
- 406 Locksley Dr
- 115 Kinkade Dr
- 0 Dixie Dr
- 150 Spring Lake Dr
- 211 Ammonwood Dr
- 206 Kinkade Dr
- 106 Whirlaway Ct
- 140 Rutledge Rd
- 106 Pennington Ln N
- 117 Pennington Ln N
- 104 Pennington Ln N
- 127 Whirlaway Ct
- 139 Whirlaway Ct
- 143 Whirlaway Ct
- 00 Deadfall Rd
- 208 Bermuda Dr
- 210 Bermuda Dr
- 120 Heather Ln
- 109 Centepede Ct
- 1510 Montague Avenue Extension