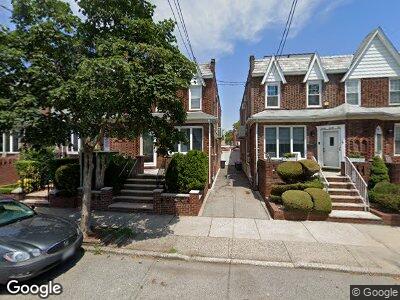
2033 E 37th St Brooklyn, NY 11234
Marine Park NeighborhoodEstimated Value: $821,000 - $918,000
--
Bed
--
Bath
1,568
Sq Ft
$541/Sq Ft
Est. Value
About This Home
This home is located at 2033 E 37th St, Brooklyn, NY 11234 and is currently estimated at $847,912, approximately $540 per square foot. 2033 E 37th St is a home located in Kings County with nearby schools including Ps 207 Elizabeth G Leary, J.H.S. 278 Marine Park, and James Madison High School.
Ownership History
Date
Name
Owned For
Owner Type
Purchase Details
Closed on
Jun 22, 2021
Sold by
Gianturco Mary J
Bought by
Li Kayla
Current Estimated Value
Home Financials for this Owner
Home Financials are based on the most recent Mortgage that was taken out on this home.
Original Mortgage
$475,000
Outstanding Balance
$439,308
Interest Rate
2.9%
Mortgage Type
Purchase Money Mortgage
Estimated Equity
$412,564
Purchase Details
Closed on
May 25, 2005
Sold by
Romano Anna Marie
Bought by
Gianturco Mary J
Create a Home Valuation Report for This Property
The Home Valuation Report is an in-depth analysis detailing your home's value as well as a comparison with similar homes in the area
Home Values in the Area
Average Home Value in this Area
Purchase History
| Date | Buyer | Sale Price | Title Company |
|---|---|---|---|
| Li Kayla | $725,000 | -- | |
| Li Kayla | $725,000 | -- | |
| Gianturco Mary J | -- | -- | |
| Gianturco Mary J | -- | -- |
Source: Public Records
Mortgage History
| Date | Status | Borrower | Loan Amount |
|---|---|---|---|
| Open | Li Kayla | $475,000 | |
| Closed | Li Kayla | $475,000 |
Source: Public Records
Tax History Compared to Growth
Tax History
| Year | Tax Paid | Tax Assessment Tax Assessment Total Assessment is a certain percentage of the fair market value that is determined by local assessors to be the total taxable value of land and additions on the property. | Land | Improvement |
|---|---|---|---|---|
| 2024 | $7,618 | $49,140 | $9,240 | $39,900 |
| 2023 | $7,645 | $53,220 | $9,240 | $43,980 |
| 2022 | $5,317 | $44,040 | $9,240 | $34,800 |
| 2021 | $7,000 | $42,660 | $9,240 | $33,420 |
| 2020 | $3,309 | $40,680 | $9,240 | $31,440 |
| 2019 | $6,612 | $45,000 | $9,240 | $35,760 |
| 2018 | $6,395 | $31,370 | $6,519 | $24,851 |
| 2017 | $6,033 | $29,595 | $6,948 | $22,647 |
| 2016 | $1,877 | $27,920 | $7,251 | $20,669 |
| 2015 | $1,286 | $26,340 | $10,260 | $16,080 |
| 2014 | $1,286 | $26,340 | $10,260 | $16,080 |
Source: Public Records
Map
Nearby Homes