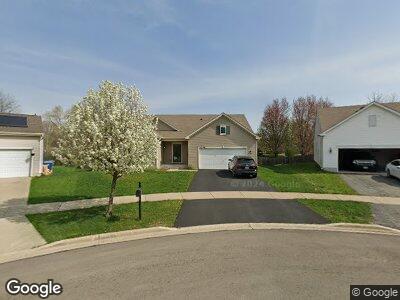
2036 Kate Ct Montgomery, IL 60538
South Montgomery NeighborhoodEstimated Value: $350,805 - $382,000
4
Beds
3
Baths
2,612
Sq Ft
$139/Sq Ft
Est. Value
About This Home
This home is located at 2036 Kate Ct, Montgomery, IL 60538 and is currently estimated at $363,701, approximately $139 per square foot. 2036 Kate Ct is a home located in Kendall County with nearby schools including Lakewood Creek Elementary School, Thompson Jr. High School, and Oswego High School.
Ownership History
Date
Name
Owned For
Owner Type
Purchase Details
Closed on
May 14, 2020
Sold by
Mohammed Saleem and Mohammed Saleema
Bought by
Haeger Cody and Payne Katie E
Current Estimated Value
Home Financials for this Owner
Home Financials are based on the most recent Mortgage that was taken out on this home.
Original Mortgage
$225,834
Outstanding Balance
$203,587
Interest Rate
3.3%
Mortgage Type
FHA
Estimated Equity
$157,551
Purchase Details
Closed on
Jan 28, 2019
Sold by
Weinstein David T and Pennymac Loan Service Llc
Bought by
Saleem Mohammed
Purchase Details
Closed on
Jan 21, 2016
Sold by
Calatlantic Group Inc
Bought by
Jaeger Kurt D
Home Financials for this Owner
Home Financials are based on the most recent Mortgage that was taken out on this home.
Original Mortgage
$237,616
Interest Rate
4.25%
Mortgage Type
FHA
Purchase Details
Closed on
Jun 1, 2013
Bought by
Ryland Group Inc
Create a Home Valuation Report for This Property
The Home Valuation Report is an in-depth analysis detailing your home's value as well as a comparison with similar homes in the area
Home Values in the Area
Average Home Value in this Area
Purchase History
| Date | Buyer | Sale Price | Title Company |
|---|---|---|---|
| Haeger Cody | $230,000 | Greater Illinois Title Co | |
| Saleem Mohammed | $170,000 | None Available | |
| Jaeger Kurt D | $250,000 | First American Title | |
| Ryland Group Inc | $877,500 | -- |
Source: Public Records
Mortgage History
| Date | Status | Borrower | Loan Amount |
|---|---|---|---|
| Open | Haeger Cody | $225,834 | |
| Previous Owner | Jaeger Kurt D | $237,616 | |
| Closed | Ryland Group Inc | -- |
Source: Public Records
Tax History Compared to Growth
Tax History
| Year | Tax Paid | Tax Assessment Tax Assessment Total Assessment is a certain percentage of the fair market value that is determined by local assessors to be the total taxable value of land and additions on the property. | Land | Improvement |
|---|---|---|---|---|
| 2023 | $8,119 | $100,098 | $9,163 | $90,935 |
| 2022 | $8,119 | $90,875 | $8,319 | $82,556 |
| 2021 | $7,849 | $85,474 | $8,319 | $77,155 |
| 2020 | $8,200 | $81,800 | $8,319 | $73,481 |
| 2019 | $8,009 | $78,662 | $8,000 | $70,662 |
| 2018 | $7,888 | $76,054 | $8,000 | $68,054 |
| 2017 | $7,612 | $74,720 | $8,000 | $66,720 |
| 2016 | $7,083 | $68,087 | $7,560 | $60,527 |
| 2015 | -- | $94 | $94 | $0 |
| 2014 | -- | $94 | $94 | $0 |
| 2013 | -- | $94 | $94 | $0 |
Source: Public Records
Map
Nearby Homes
- 2631 Bluegrass Dr
- 2069 Kate Dr
- 2090 Sand Hill Ct
- 2191 Kathleen Cir
- 2121 Kathleen Cir
- 2242 Brentwood Ave
- 2668 Jenna Cir Unit 1
- 2422 Roxbury Ln Unit 2
- 2639 Jenna Cir
- 2426 Mayfield Dr
- 2470 Mayfield Ct Unit 2
- 2117 Rebecca Cir
- 2805 Oakmont Dr
- 2160 Rebecca Cir
- 2450 Geneva Ln
- 2834 Troon Dr
- 2854 Frances Ln
- 1943 Waverly Way
- 2811 Silver Springs Ct
- 2461 Hillsboro Ln