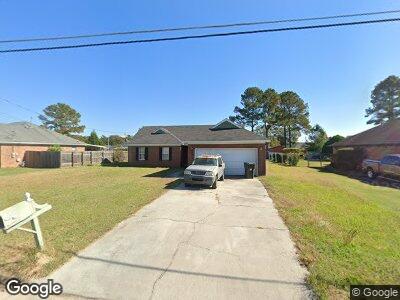
2044 Bassford Dr Hephzibah, GA 30815
Jamestown NeighborhoodEstimated Value: $200,000 - $278,000
3
Beds
2
Baths
1,600
Sq Ft
$143/Sq Ft
Est. Value
About This Home
This home is located at 2044 Bassford Dr, Hephzibah, GA 30815 and is currently estimated at $228,002, approximately $142 per square foot. 2044 Bassford Dr is a home located in Richmond County with nearby schools including Deer Chase Elementary School, Willis Foreman Elementary School, and Hephzibah Middle School.
Ownership History
Date
Name
Owned For
Owner Type
Purchase Details
Closed on
Jun 29, 2007
Sold by
Solomon Jane P
Bought by
Mingledolph Tabatha A
Current Estimated Value
Home Financials for this Owner
Home Financials are based on the most recent Mortgage that was taken out on this home.
Original Mortgage
$95,993
Interest Rate
6.37%
Mortgage Type
FHA
Purchase Details
Closed on
Aug 10, 2001
Sold by
Va
Bought by
Solomon Jane P
Home Financials for this Owner
Home Financials are based on the most recent Mortgage that was taken out on this home.
Original Mortgage
$75,769
Interest Rate
6.98%
Purchase Details
Closed on
Apr 4, 2000
Sold by
Ba Mtg Llc
Bought by
Va
Purchase Details
Closed on
Jan 17, 1996
Sold by
Richmond Builders I
Bought by
Middlebrook Bobby J
Create a Home Valuation Report for This Property
The Home Valuation Report is an in-depth analysis detailing your home's value as well as a comparison with similar homes in the area
Home Values in the Area
Average Home Value in this Area
Purchase History
| Date | Buyer | Sale Price | Title Company |
|---|---|---|---|
| Mingledolph Tabatha A | $97,500 | None Available | |
| Solomon Jane P | $65,822 | -- | |
| Va | -- | -- | |
| Nationsbanc Mtg Corp | $70,504 | -- | |
| Middlebrook Bobby J | $83,000 | -- | |
| Southern Specialty Dev Co Inc | -- | -- |
Source: Public Records
Mortgage History
| Date | Status | Borrower | Loan Amount |
|---|---|---|---|
| Open | Mingledolph Tabatha A | $95,993 | |
| Closed | Mingledolph Tabatha A | $95,993 | |
| Previous Owner | Solomon Jane P | $79,000 | |
| Previous Owner | Solomon Jane P | $75,769 |
Source: Public Records
Tax History Compared to Growth
Tax History
| Year | Tax Paid | Tax Assessment Tax Assessment Total Assessment is a certain percentage of the fair market value that is determined by local assessors to be the total taxable value of land and additions on the property. | Land | Improvement |
|---|---|---|---|---|
| 2024 | -- | $78,756 | $8,000 | $70,756 |
| 2023 | $1,633 | $71,860 | $8,000 | $63,860 |
| 2022 | $1,826 | $56,071 | $8,000 | $48,071 |
| 2021 | $1,453 | $39,422 | $8,000 | $31,422 |
| 2020 | $1,433 | $39,422 | $8,000 | $31,422 |
| 2019 | $1,509 | $39,422 | $8,000 | $31,422 |
| 2018 | $1,519 | $39,422 | $8,000 | $31,422 |
| 2017 | $1,477 | $39,422 | $8,000 | $31,422 |
| 2016 | $1,478 | $39,422 | $8,000 | $31,422 |
| 2015 | $1,487 | $39,422 | $8,000 | $31,422 |
| 2014 | $1,473 | $38,930 | $8,000 | $30,930 |
Source: Public Records
Map
Nearby Homes
- 2795 Davis Mill Rd
- 1114 Waltons Trail
- 1503 Brookstone Rd
- 3955 Lace Rd Unit A
- 3955 Lace Rd Unit D
- 3955 Lace Rd Unit B
- 1855 Beaver Creek Ln
- 2213 Riley Ct
- 1708 Ethan Way
- 1722 Ethan Way
- 2897 Lake Erie Dr
- 4441 Dave MacDonald Dr
- 1612 Creek Run Rd
- 2933 Easton Dr
- 2161 Kaneck Way
- 2159 Kaneck Way
- 3807 Fairington Dr
- 218 Willowton Ln
- 1505 Sandstone Ln
- 4456 Dave MacDonald Dr