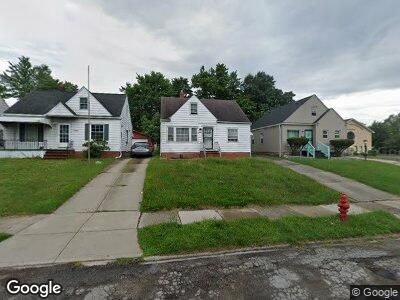
20504 Hansen Rd Maple Heights, OH 44137
Estimated Value: $102,120 - $122,000
3
Beds
1
Bath
1,092
Sq Ft
$102/Sq Ft
Est. Value
About This Home
This home is located at 20504 Hansen Rd, Maple Heights, OH 44137 and is currently estimated at $111,030, approximately $101 per square foot. 20504 Hansen Rd is a home located in Cuyahoga County with nearby schools including Abraham Lincoln Elementary School, Rockside/ J.F. Kennedy School, and Barack Obama School.
Ownership History
Date
Name
Owned For
Owner Type
Purchase Details
Closed on
Jun 7, 2023
Sold by
Gamer Ashley
Bought by
Allen Dennis
Current Estimated Value
Purchase Details
Closed on
Jun 15, 2022
Sold by
Walter Johnson Jr
Bought by
Garner Ashley
Purchase Details
Closed on
Apr 30, 1992
Sold by
Johnson Walter B
Bought by
Johnson Walter B
Purchase Details
Closed on
Dec 29, 1987
Bought by
Johnson Walter B
Purchase Details
Closed on
Jan 19, 1979
Sold by
Reinhart George H
Bought by
Tratnik Frances E
Purchase Details
Closed on
May 18, 1978
Sold by
Reinhart Geo H and Reinhart Mildred
Bought by
Reinhart George H
Purchase Details
Closed on
Jan 1, 1975
Bought by
Reinhart Geo H and Reinhart Mildred
Create a Home Valuation Report for This Property
The Home Valuation Report is an in-depth analysis detailing your home's value as well as a comparison with similar homes in the area
Home Values in the Area
Average Home Value in this Area
Purchase History
| Date | Buyer | Sale Price | Title Company |
|---|---|---|---|
| Allen Dennis | -- | None Listed On Document | |
| Garner Ashley | -- | Johnson Walter Jr | |
| Johnson Walter B | -- | -- | |
| Johnson Walter B | $40,000 | -- | |
| Estate Of Patricia I Matthew | -- | -- | |
| Tratnik Frances E | $35,000 | -- | |
| Reinhart George H | -- | -- | |
| Reinhart Geo H | -- | -- |
Source: Public Records
Mortgage History
| Date | Status | Borrower | Loan Amount |
|---|---|---|---|
| Previous Owner | Johnson Walter B | $55,000 | |
| Previous Owner | Johnson Walter B | $21,422 |
Source: Public Records
Tax History Compared to Growth
Tax History
| Year | Tax Paid | Tax Assessment Tax Assessment Total Assessment is a certain percentage of the fair market value that is determined by local assessors to be the total taxable value of land and additions on the property. | Land | Improvement |
|---|---|---|---|---|
| 2024 | $3,284 | $30,800 | $6,055 | $24,745 |
| 2023 | $2,477 | $18,340 | $3,640 | $14,700 |
| 2022 | $2,057 | $18,340 | $3,640 | $14,700 |
| 2021 | $6,457 | $18,340 | $3,640 | $14,700 |
| 2020 | $2,941 | $13,900 | $2,770 | $11,130 |
| 2019 | $5,275 | $39,700 | $7,900 | $31,800 |
| 2018 | $1,395 | $13,900 | $2,770 | $11,130 |
| 2017 | $1,671 | $12,920 | $2,590 | $10,330 |
| 2016 | $660 | $12,920 | $2,590 | $10,330 |
| 2015 | $726 | $12,920 | $2,590 | $10,330 |
| 2014 | $726 | $14,180 | $2,840 | $11,340 |
Source: Public Records
Map
Nearby Homes
- 20814 Raymond St
- 21011 Hansen Rd
- 21012 Hillgrove Ave
- 19617 Nitra Ave
- 19901 Gardenview Dr
- 19605 Milan Dr
- 19802 Mountville Dr
- 5141 Camden Rd
- 21417 Gardenview Dr
- 19816 Stockton Ave
- 18906 Fairway Ave
- 21880 Louis Rd
- 18740 Raymond St
- 18707 Longview Ave
- 5151 Erwin St
- 20698 Bowling Green Rd
- 20287 Emery Rd
- 18605 Maple Heights Blvd
- 5131 Arch St
- 18230 Libby Rd