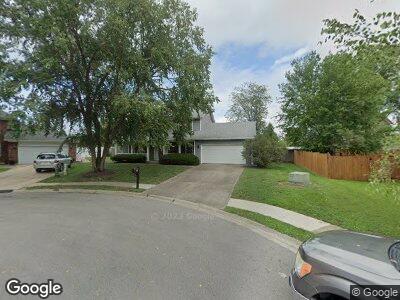
206 Birch Creek Ct O Fallon, IL 62269
Winding Creek Estates NeighborhoodEstimated Value: $330,000 - $358,000
4
Beds
4
Baths
2,000
Sq Ft
$171/Sq Ft
Est. Value
About This Home
This home is located at 206 Birch Creek Ct, O Fallon, IL 62269 and is currently estimated at $342,305, approximately $171 per square foot. 206 Birch Creek Ct is a home located in St. Clair County with nearby schools including Kampmeyer Elementary School, Carriel Junior High School, and O'Fallon Township High School.
Ownership History
Date
Name
Owned For
Owner Type
Purchase Details
Closed on
Sep 21, 2018
Sold by
Goff Matthew T and Goff Hannah R
Bought by
Goff Matthew Tristan
Current Estimated Value
Purchase Details
Closed on
Sep 3, 2009
Sold by
Monroe Mitchell and Monroe Cathleen M
Bought by
Goff Matthew Tristan and Goff Hannah Ruth
Home Financials for this Owner
Home Financials are based on the most recent Mortgage that was taken out on this home.
Original Mortgage
$193,574
Interest Rate
5.28%
Mortgage Type
VA
Purchase Details
Closed on
Jun 29, 2001
Sold by
Moening Colin R and Moening Patricia A
Bought by
Monroe Mitchell and Monroe Cathleen M
Home Financials for this Owner
Home Financials are based on the most recent Mortgage that was taken out on this home.
Original Mortgage
$166,155
Interest Rate
7.2%
Create a Home Valuation Report for This Property
The Home Valuation Report is an in-depth analysis detailing your home's value as well as a comparison with similar homes in the area
Home Values in the Area
Average Home Value in this Area
Purchase History
| Date | Buyer | Sale Price | Title Company |
|---|---|---|---|
| Goff Matthew Tristan | -- | Attorney | |
| Goff Matthew Tristan | $189,500 | Fatic | |
| Monroe Mitchell | $175,000 | First County Title Co |
Source: Public Records
Mortgage History
| Date | Status | Borrower | Loan Amount |
|---|---|---|---|
| Open | Goff Matthew Tristan | $151,057 | |
| Closed | Goff Matthew Tristan | $156,190 | |
| Closed | Goff Matthew Tristan | $177,363 | |
| Closed | Goff Matthew Tristan | $196,120 | |
| Closed | Goff Matthew Tristan | $202,395 | |
| Closed | Goff Matthew Tristan | $201,179 | |
| Closed | Goff Matthew Tristan | $193,574 | |
| Previous Owner | Monroe Mitchell A | $168,150 | |
| Previous Owner | Monroe Mitchell | $166,155 |
Source: Public Records
Tax History Compared to Growth
Tax History
| Year | Tax Paid | Tax Assessment Tax Assessment Total Assessment is a certain percentage of the fair market value that is determined by local assessors to be the total taxable value of land and additions on the property. | Land | Improvement |
|---|---|---|---|---|
| 2023 | $5,635 | $85,370 | $16,854 | $68,516 |
| 2022 | $5,260 | $78,487 | $15,495 | $62,992 |
| 2021 | $5,114 | $75,413 | $15,545 | $59,868 |
| 2020 | $5,061 | $71,385 | $14,715 | $56,670 |
| 2019 | $4,922 | $71,385 | $14,715 | $56,670 |
| 2018 | $4,770 | $69,313 | $14,288 | $55,025 |
| 2017 | $4,806 | $67,557 | $15,651 | $51,906 |
| 2016 | $4,785 | $65,980 | $15,286 | $50,694 |
| 2014 | $4,604 | $65,217 | $15,109 | $50,108 |
| 2013 | $5,077 | $66,163 | $14,877 | $51,286 |
Source: Public Records
Map
Nearby Homes
- 1470 Schwarz Meadow Rd
- 425 Deer Creek Rd
- 1041 Stonybrook Dr
- 1029 Stonybrook Dr
- 160 Chickasaw Ln
- 7 Wildwood Ln
- 252 Shawnee Ct
- 1246 Elisabeth Dr
- 143 Chickasaw Ln
- 108 Chickasaw Ln
- 121 Chickasaw Ln
- 1509 Cedar Ridge Dr
- 1341 Sauk Trail
- 1408 Cedar Ridge Dr
- 1230 Conrad Ln
- 106 Jennifer Ct
- 0 Glen Hollow Dr
- 926 MacEs Grove Rd
- 1212 Usher Dr
- 354 Dennison Dr