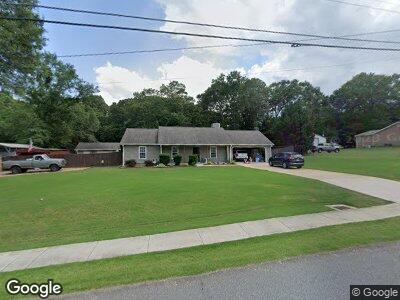
2063 Providence Rd Unit II Statham, GA 30666
Estimated Value: $256,520 - $301,000
--
Bed
2
Baths
1,422
Sq Ft
$202/Sq Ft
Est. Value
About This Home
This home is located at 2063 Providence Rd Unit II, Statham, GA 30666 and is currently estimated at $287,130, approximately $201 per square foot. 2063 Providence Rd Unit II is a home located in Barrow County with nearby schools including Statham Elementary School, Bear Creek Middle School, and Winder-Barrow High School.
Ownership History
Date
Name
Owned For
Owner Type
Purchase Details
Closed on
Dec 17, 2007
Sold by
Peek Timothy D
Bought by
Peek Timothy D and Peek Leslie A
Current Estimated Value
Home Financials for this Owner
Home Financials are based on the most recent Mortgage that was taken out on this home.
Original Mortgage
$110,400
Interest Rate
6.21%
Mortgage Type
New Conventional
Purchase Details
Closed on
Sep 29, 2000
Sold by
Manus Thomas R and Manus Shirley E
Bought by
Peek Timothy D
Home Financials for this Owner
Home Financials are based on the most recent Mortgage that was taken out on this home.
Original Mortgage
$101,562
Interest Rate
7.97%
Mortgage Type
FHA
Purchase Details
Closed on
Sep 13, 1996
Sold by
Wt S Bldrs
Bought by
Manus Thomas Shirley
Purchase Details
Closed on
Jan 17, 1996
Sold by
Wts Drywall Co
Bought by
Wts Bldrs
Create a Home Valuation Report for This Property
The Home Valuation Report is an in-depth analysis detailing your home's value as well as a comparison with similar homes in the area
Home Values in the Area
Average Home Value in this Area
Purchase History
| Date | Buyer | Sale Price | Title Company |
|---|---|---|---|
| Peek Timothy D | -- | -- | |
| Peek Timothy D | $102,400 | -- | |
| Manus Thomas Shirley | $77,700 | -- | |
| Wts Bldrs | $15,000 | -- |
Source: Public Records
Mortgage History
| Date | Status | Borrower | Loan Amount |
|---|---|---|---|
| Open | Peek Timothy D | $105,000 | |
| Closed | Peek Timothy D | $110,400 | |
| Previous Owner | Peek Timothy D | $22,000 | |
| Previous Owner | Peek Timothy D | $98,400 | |
| Previous Owner | Peek Timothy D | $12,300 | |
| Previous Owner | Peek Timothy D | $101,562 | |
| Previous Owner | Manus Thomas | $74,000 | |
| Closed | Manus Thomas Shirley | $0 |
Source: Public Records
Tax History Compared to Growth
Tax History
| Year | Tax Paid | Tax Assessment Tax Assessment Total Assessment is a certain percentage of the fair market value that is determined by local assessors to be the total taxable value of land and additions on the property. | Land | Improvement |
|---|---|---|---|---|
| 2024 | $1,713 | $66,418 | $10,400 | $56,018 |
| 2023 | $1,007 | $66,418 | $10,400 | $56,018 |
| 2022 | $1,311 | $50,849 | $10,400 | $40,449 |
| 2021 | $1,390 | $50,849 | $10,400 | $40,449 |
| 2020 | $1,390 | $50,849 | $10,400 | $40,449 |
| 2019 | $1,409 | $50,849 | $10,400 | $40,449 |
| 2018 | $1,397 | $50,849 | $10,400 | $40,449 |
| 2017 | $1,292 | $37,034 | $10,400 | $26,634 |
| 2016 | $1,054 | $37,339 | $10,400 | $26,939 |
| 2015 | $1,066 | $37,645 | $10,400 | $27,245 |
| 2014 | $893 | $33,736 | $5,880 | $27,856 |
| 2013 | -- | $32,486 | $5,880 | $26,606 |
Source: Public Records
Map
Nearby Homes
- 97 Dockside Dr
- 13 Charlotte Cir
- 123 Charlotte Cir
- 264 Charlotte Cir
- 31 Charlotte Cir
- 397 April Ct Unit 3
- 261 Jefferson St
- 464 Hammond Rd Unit 1
- 673 Graham Campbell Ln
- 361 Graham Campbell Ln
- 1198 Daurian Dr
- 1943 Atlanta Hwy SE
- 210 Hummingbird Ln Unit 8
- 2721 Lily Ln
- 1931 Blazing Star Ct
- 1472 Lily Ln
- 1907 Broad St
- 0 1st St Unit 7377355
- 0 1st St Unit 10288968
- 1892 Broad St