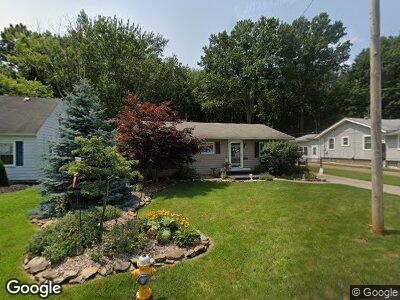
208 Fay Ave Avon Lake, OH 44012
Estimated Value: $233,572 - $294,000
3
Beds
2
Baths
1,120
Sq Ft
$237/Sq Ft
Est. Value
About This Home
This home is located at 208 Fay Ave, Avon Lake, OH 44012 and is currently estimated at $265,893, approximately $237 per square foot. 208 Fay Ave is a home located in Lorain County with nearby schools including Erieview Elementary School, Troy Intermediate Elementary School, and Learwood Middle School.
Ownership History
Date
Name
Owned For
Owner Type
Purchase Details
Closed on
Apr 22, 2023
Sold by
Krebs Richard H and Krebs Carolyn L
Bought by
Krebs Annette S
Current Estimated Value
Purchase Details
Closed on
Mar 13, 2018
Sold by
Krebs Annette S
Bought by
Krebs Annette S and Krebs Richard H
Purchase Details
Closed on
May 30, 2000
Sold by
Griffing David W
Bought by
Krebs Annette S and Nimon Wyatt J
Home Financials for this Owner
Home Financials are based on the most recent Mortgage that was taken out on this home.
Original Mortgage
$108,300
Interest Rate
8.14%
Purchase Details
Closed on
Mar 15, 2000
Sold by
Nauth Loren Trustee
Bought by
Griffing David W
Create a Home Valuation Report for This Property
The Home Valuation Report is an in-depth analysis detailing your home's value as well as a comparison with similar homes in the area
Home Values in the Area
Average Home Value in this Area
Purchase History
| Date | Buyer | Sale Price | Title Company |
|---|---|---|---|
| Krebs Annette S | -- | None Listed On Document | |
| Krebs Annette S | -- | Old Republic National Title | |
| Krebs Annette S | -- | Old Republic National Title | |
| Krebs Annette S | $114,000 | Chicago Title Insurance Comp | |
| Griffing David W | $81,400 | -- |
Source: Public Records
Mortgage History
| Date | Status | Borrower | Loan Amount |
|---|---|---|---|
| Previous Owner | Nimon Wyatt J | $73,500 | |
| Previous Owner | Nimon Annette S | $7,700 | |
| Previous Owner | Nimon Wyatt J | $13,580 | |
| Previous Owner | Nimon Wyatt J | $105,800 | |
| Previous Owner | Krebs Annette S | $108,300 |
Source: Public Records
Tax History Compared to Growth
Tax History
| Year | Tax Paid | Tax Assessment Tax Assessment Total Assessment is a certain percentage of the fair market value that is determined by local assessors to be the total taxable value of land and additions on the property. | Land | Improvement |
|---|---|---|---|---|
| 2024 | $3,046 | $64,327 | $19,149 | $45,178 |
| 2023 | $2,922 | $54,800 | $17,864 | $36,936 |
| 2022 | $2,891 | $54,800 | $17,864 | $36,936 |
| 2021 | $2,885 | $54,800 | $17,860 | $36,940 |
| 2020 | $2,559 | $45,030 | $14,750 | $30,280 |
| 2019 | $2,545 | $45,030 | $14,750 | $30,280 |
| 2018 | $2,554 | $45,030 | $14,750 | $30,280 |
| 2017 | $2,458 | $40,000 | $13,830 | $26,170 |
| 2016 | $2,446 | $40,000 | $13,830 | $26,170 |
| 2015 | $2,458 | $40,000 | $13,830 | $26,170 |
| 2014 | $2,317 | $35,950 | $12,430 | $23,520 |
| 2013 | $2,335 | $35,950 | $12,430 | $23,520 |
Source: Public Records
Map
Nearby Homes
- 213 Fay Ave
- 201 Yoder Blvd
- 32569 Electric Blvd
- 147 Englewood Dr
- S/L 2 Redwood Blvd
- S/L 1 Redwood Blvd
- 55 Coveland Dr
- 32282 Dakota Run
- 32662 Lake Rd
- 32713 Greenwood Ct
- 345 Avon Belden Rd
- 32145 Ventanas Cir
- 352 Avon Belden Rd
- 32894 Lake Rd
- 184 Lakewood Dr
- 187 Lakewood Dr
- 244 S Point Dr
- 155 Beachwood Ave
- 0 Avon Belden Rd
- 18 Community Dr Unit 18