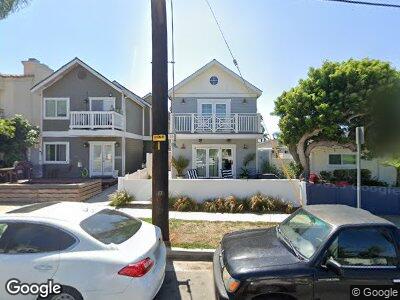
208 Indianapolis Ave Unit B Huntington Beach, CA 92648
Yorktown NeighborhoodEstimated Value: $2,109,000 - $2,604,000
1
Bed
1
Bath
800
Sq Ft
$3,039/Sq Ft
Est. Value
About This Home
This home is located at 208 Indianapolis Ave Unit B, Huntington Beach, CA 92648 and is currently estimated at $2,431,040, approximately $3,038 per square foot. 208 Indianapolis Ave Unit B is a home located in Orange County with nearby schools including Agnes L. Smith Elementary, Ethel Dwyer Middle, and Huntington Beach High School.
Ownership History
Date
Name
Owned For
Owner Type
Purchase Details
Closed on
Feb 17, 2023
Sold by
Baez Trust
Bought by
Hbdb Investment Llc
Current Estimated Value
Purchase Details
Closed on
Sep 20, 2022
Sold by
Indianapolis Llc
Bought by
Baez Trust
Purchase Details
Closed on
Oct 19, 2020
Sold by
Ashurst Roberta L
Bought by
Indianapolis Llc
Home Financials for this Owner
Home Financials are based on the most recent Mortgage that was taken out on this home.
Original Mortgage
$1,250,000
Interest Rate
2.8%
Mortgage Type
Commercial
Create a Home Valuation Report for This Property
The Home Valuation Report is an in-depth analysis detailing your home's value as well as a comparison with similar homes in the area
Home Values in the Area
Average Home Value in this Area
Purchase History
| Date | Buyer | Sale Price | Title Company |
|---|---|---|---|
| Hbdb Investment Llc | -- | -- | |
| Baez Trust | $2,380,000 | Wfg National Title | |
| Indianapolis Llc | $1,070,000 | Wfg National Title Company |
Source: Public Records
Mortgage History
| Date | Status | Borrower | Loan Amount |
|---|---|---|---|
| Previous Owner | Indlanapilis Llc | $1,575,000 | |
| Previous Owner | Indianapolis Llc | $60,000 | |
| Previous Owner | Indianapolis Llc | $100,000 | |
| Previous Owner | Indianapolis Llc | $1,250,000 | |
| Previous Owner | Ashurst Roberta L | $311,200 | |
| Previous Owner | Ashurst Roberta L | $329,500 | |
| Previous Owner | Ashurst Roberta L | $13,500 | |
| Previous Owner | Ashurst Roberta L | $330,000 | |
| Previous Owner | Ashurst Roberta L | $265,000 |
Source: Public Records
Tax History Compared to Growth
Tax History
| Year | Tax Paid | Tax Assessment Tax Assessment Total Assessment is a certain percentage of the fair market value that is determined by local assessors to be the total taxable value of land and additions on the property. | Land | Improvement |
|---|---|---|---|---|
| 2024 | $27,158 | $2,427,600 | $2,156,036 | $271,564 |
| 2023 | $26,562 | $2,380,000 | $2,113,760 | $266,240 |
| 2022 | $12,296 | $1,091,400 | $837,959 | $253,441 |
| 2021 | $12,068 | $1,070,000 | $821,528 | $248,472 |
| 2020 | $4,613 | $387,376 | $118,841 | $268,535 |
| 2019 | $4,561 | $379,781 | $116,511 | $263,270 |
| 2018 | $4,491 | $372,335 | $114,227 | $258,108 |
| 2017 | $4,432 | $365,035 | $111,987 | $253,048 |
| 2016 | $4,240 | $357,878 | $109,791 | $248,087 |
| 2015 | $4,199 | $352,503 | $108,142 | $244,361 |
| 2014 | $4,111 | $345,598 | $106,023 | $239,575 |
Source: Public Records
Map
Nearby Homes
- 218 Indianapolis Ave
- 201 Indianapolis Ave
- 203 Indianapolis Ave
- 901 Huntington St
- 714 Alabama St
- 905 California St
- 1002 Huntington St
- 620 Huntington St
- 204 Lincoln Ave
- 613 Delaware St
- 215 Lincoln Ave
- 1016 Delaware St
- 520 8th St
- 506 7th St
- 613 Frankfort Ave
- 311 Alabama St
- 222 Detroit Ave
- 420 7th St
- 414 Main St Unit 305
- 414 Main St Unit 415