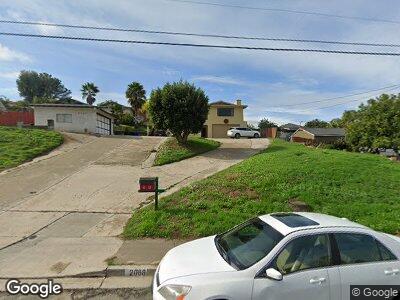
2088 Oriole St San Diego, CA 92114
Encanto NeighborhoodEstimated Value: $755,000 - $900,000
4
Beds
3
Baths
1,636
Sq Ft
$501/Sq Ft
Est. Value
About This Home
This home is located at 2088 Oriole St, San Diego, CA 92114 and is currently estimated at $819,352, approximately $500 per square foot. 2088 Oriole St is a home located in San Diego County with nearby schools including Encanto Elementary School, Millennial Tech Middle School, and Lincoln High School.
Ownership History
Date
Name
Owned For
Owner Type
Purchase Details
Closed on
Jun 28, 2019
Sold by
Brunner Nicholas
Bought by
Brunner Nicholas and Brunner Sahar
Current Estimated Value
Home Financials for this Owner
Home Financials are based on the most recent Mortgage that was taken out on this home.
Original Mortgage
$350,000
Outstanding Balance
$312,213
Interest Rate
4%
Mortgage Type
New Conventional
Estimated Equity
$496,387
Purchase Details
Closed on
Feb 10, 2016
Sold by
Brunner Nicholas
Bought by
Brunner Nicholas and Brunner Sahar
Purchase Details
Closed on
Nov 6, 2014
Sold by
Brunner Nicholas and Brunner Nick
Bought by
Brunner Nicholas
Purchase Details
Closed on
Jun 16, 2011
Sold by
Carter Thomas M
Bought by
Brunner Nick
Home Financials for this Owner
Home Financials are based on the most recent Mortgage that was taken out on this home.
Original Mortgage
$288,063
Interest Rate
4.45%
Mortgage Type
VA
Purchase Details
Closed on
Jul 2, 2004
Sold by
Carter Calvin James
Bought by
Carter Calvin J and Carter Thomas M
Create a Home Valuation Report for This Property
The Home Valuation Report is an in-depth analysis detailing your home's value as well as a comparison with similar homes in the area
Home Values in the Area
Average Home Value in this Area
Purchase History
| Date | Buyer | Sale Price | Title Company |
|---|---|---|---|
| Brunner Nicholas | -- | Accommodation | |
| Brunner Nicholas | -- | Stewart Title Of Ca Inc | |
| Brunner Nicholas | -- | Accommodation | |
| Brunner Nicholas | -- | Title365.Com | |
| Brunner Nicholas | -- | Title365.Com | |
| Brunner Nick | $282,000 | None Available | |
| Carter Calvin J | -- | -- |
Source: Public Records
Mortgage History
| Date | Status | Borrower | Loan Amount |
|---|---|---|---|
| Open | Brunner Nicholas | $350,000 | |
| Closed | Brunner Nick | $285,000 | |
| Closed | Brunner Nick | $283,912 | |
| Closed | Brunner Nick | $288,063 |
Source: Public Records
Tax History Compared to Growth
Tax History
| Year | Tax Paid | Tax Assessment Tax Assessment Total Assessment is a certain percentage of the fair market value that is determined by local assessors to be the total taxable value of land and additions on the property. | Land | Improvement |
|---|---|---|---|---|
| 2024 | $4,300 | $347,247 | $61,146 | $286,101 |
| 2023 | $4,204 | $340,440 | $59,948 | $280,492 |
| 2022 | $4,093 | $333,766 | $58,773 | $274,993 |
| 2021 | $4,065 | $327,222 | $57,621 | $269,601 |
| 2020 | $4,016 | $323,868 | $57,031 | $266,837 |
| 2019 | $3,945 | $317,518 | $55,913 | $261,605 |
| 2018 | $3,689 | $311,293 | $54,817 | $256,476 |
| 2017 | $3,601 | $305,191 | $53,743 | $251,448 |
| 2016 | $3,461 | $299,208 | $52,690 | $246,518 |
| 2015 | $3,409 | $294,715 | $51,899 | $242,816 |
| 2014 | $3,437 | $288,943 | $50,883 | $238,060 |
Source: Public Records
Map
Nearby Homes
- 0 Tooley Unit PTP2501806
- Vacant Lot - Swan St Unit 36
- 1726 Swan St
- 2351 Star Pine Dr
- 6525 Macarthur Dr
- 6580 Radio Dr
- Lot 2 Weaver St Unit 2
- Lot 1 Weaver St Unit 1
- 1846 Klauber Ave
- 1350 Weaver St
- 0 Mallard St
- 2271 Laconia St
- 2003 Bayview Heights Dr Unit 40
- 2003 Bayview Heights Dr Unit 70
- 2003 Bayview Heights Dr Unit 83
- 2003 Bayview Heights Dr Unit 176
- 2003 Bayview Heights Dr Unit 157
- 2003 Bayview Heights Dr Unit 168
- 2003 Bayview Heights Dr Unit 34
- 2003 Bayview Heights Dr Unit 108