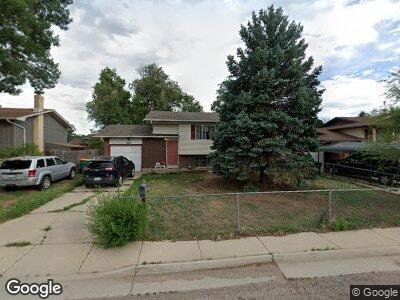
209 Fay Dr Colorado Springs, CO 80911
Widefield NeighborhoodEstimated Value: $296,728 - $372,000
3
Beds
2
Baths
854
Sq Ft
$401/Sq Ft
Est. Value
About This Home
This home is located at 209 Fay Dr, Colorado Springs, CO 80911 and is currently estimated at $342,182, approximately $400 per square foot. 209 Fay Dr is a home located in El Paso County with nearby schools including Webster Elementary School, Watson Junior High School, and Mesa Ridge High School.
Ownership History
Date
Name
Owned For
Owner Type
Purchase Details
Closed on
Jun 5, 2013
Sold by
Heitz Dennis J and Heitz Bianca A
Bought by
Colfin Ai & Co 1 Llc
Current Estimated Value
Purchase Details
Closed on
Jan 10, 2011
Sold by
Heitz Bianca A and Heitz Bond Bianca A
Bought by
Heitz Dennis J
Purchase Details
Closed on
Mar 15, 1999
Sold by
Fillinger Raymond A and Fillinger Helga G
Bought by
Heitz Dennis J and Heitz Bianca A
Home Financials for this Owner
Home Financials are based on the most recent Mortgage that was taken out on this home.
Original Mortgage
$108,120
Interest Rate
6.74%
Mortgage Type
VA
Purchase Details
Closed on
May 20, 1994
Sold by
Wilson Helen E
Bought by
Fillinger Raymond A and Fillinger Helga G
Home Financials for this Owner
Home Financials are based on the most recent Mortgage that was taken out on this home.
Original Mortgage
$90,150
Interest Rate
8.5%
Mortgage Type
VA
Create a Home Valuation Report for This Property
The Home Valuation Report is an in-depth analysis detailing your home's value as well as a comparison with similar homes in the area
Home Values in the Area
Average Home Value in this Area
Purchase History
| Date | Buyer | Sale Price | Title Company |
|---|---|---|---|
| Colfin Ai & Co 1 Llc | -- | None Available | |
| Heitz Dennis J | -- | None Available | |
| Heitz Dennis J | $106,000 | First American | |
| Fillinger Raymond A | $88,400 | -- |
Source: Public Records
Mortgage History
| Date | Status | Borrower | Loan Amount |
|---|---|---|---|
| Previous Owner | Heitz Dennis J | $127,200 | |
| Previous Owner | Heitz Dennis J | $31,800 | |
| Previous Owner | Heitz Dennis J | $130,000 | |
| Previous Owner | Heitz Bianca A | $20,000 | |
| Previous Owner | Heitz Dennis J | $108,120 | |
| Previous Owner | Fillinger Raymond A | $90,150 |
Source: Public Records
Tax History Compared to Growth
Tax History
| Year | Tax Paid | Tax Assessment Tax Assessment Total Assessment is a certain percentage of the fair market value that is determined by local assessors to be the total taxable value of land and additions on the property. | Land | Improvement |
|---|---|---|---|---|
| 2024 | $1,359 | $24,050 | $4,820 | $19,230 |
| 2023 | $1,359 | $24,050 | $4,820 | $19,230 |
| 2022 | $1,103 | $15,820 | $3,410 | $12,410 |
| 2021 | $1,192 | $16,260 | $3,500 | $12,760 |
| 2020 | $904 | $12,080 | $3,070 | $9,010 |
| 2019 | $898 | $12,080 | $3,070 | $9,010 |
| 2018 | $803 | $10,130 | $2,340 | $7,790 |
| 2017 | $813 | $10,130 | $2,340 | $7,790 |
| 2016 | $666 | $10,320 | $2,390 | $7,930 |
| 2015 | $685 | $10,320 | $2,390 | $7,930 |
| 2014 | $630 | $9,590 | $2,390 | $7,200 |
Source: Public Records
Map
Nearby Homes