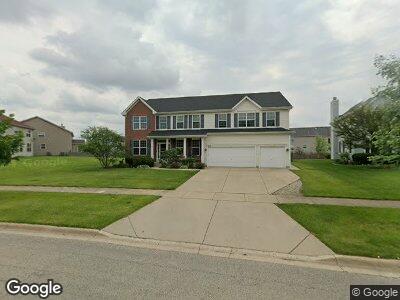
209 Willington Way Oswego, IL 60543
South Oswego NeighborhoodEstimated Value: $538,000 - $567,149
4
Beds
4
Baths
3,888
Sq Ft
$142/Sq Ft
Est. Value
About This Home
This home is located at 209 Willington Way, Oswego, IL 60543 and is currently estimated at $553,287, approximately $142 per square foot. 209 Willington Way is a home located in Kendall County with nearby schools including Southbury Elementary School, Traughber Junior High School, and Oswego High School.
Ownership History
Date
Name
Owned For
Owner Type
Purchase Details
Closed on
Dec 17, 2011
Sold by
Rashkow Dean E and Merigold Rashkow Caroline Lee
Bought by
Rashkow Dean E and Merigold Rashkow Caroline
Current Estimated Value
Purchase Details
Closed on
Dec 3, 2009
Sold by
Leon Carlo and Leon Thomasine
Bought by
Merigold Rashkow Caroline Lee and Rashkow Dean
Home Financials for this Owner
Home Financials are based on the most recent Mortgage that was taken out on this home.
Original Mortgage
$220,000
Interest Rate
4.96%
Mortgage Type
New Conventional
Purchase Details
Closed on
Apr 20, 2005
Sold by
Realen Homes Lp
Bought by
Leon Carlo and Leon Thomasine
Home Financials for this Owner
Home Financials are based on the most recent Mortgage that was taken out on this home.
Original Mortgage
$315,811
Interest Rate
5.37%
Mortgage Type
Fannie Mae Freddie Mac
Create a Home Valuation Report for This Property
The Home Valuation Report is an in-depth analysis detailing your home's value as well as a comparison with similar homes in the area
Home Values in the Area
Average Home Value in this Area
Purchase History
| Date | Buyer | Sale Price | Title Company |
|---|---|---|---|
| Rashkow Dean E | -- | None Available | |
| Merigold Rashkow Caroline Lee | $275,000 | First American Title | |
| Leon Carlo | $395,000 | Chicago Title Insurance Co |
Source: Public Records
Mortgage History
| Date | Status | Borrower | Loan Amount |
|---|---|---|---|
| Open | Rashkow Dean E | $25,000 | |
| Open | Rashkow Dean E | $282,000 | |
| Closed | Rashkow Dean E | $280,000 | |
| Closed | Merigold Rashkow Caroline Lee | $218,000 | |
| Closed | Merigold Rashkow Caroline Lee | $27,500 | |
| Closed | Merigold Rashkow Caroline Lee | $220,000 | |
| Previous Owner | Leon Carlo | $320,000 | |
| Previous Owner | Leon Carlo | $315,811 |
Source: Public Records
Tax History Compared to Growth
Tax History
| Year | Tax Paid | Tax Assessment Tax Assessment Total Assessment is a certain percentage of the fair market value that is determined by local assessors to be the total taxable value of land and additions on the property. | Land | Improvement |
|---|---|---|---|---|
| 2023 | $11,587 | $143,714 | $34,891 | $108,823 |
| 2022 | $11,587 | $134,312 | $32,608 | $101,704 |
| 2021 | $10,863 | $122,102 | $29,644 | $92,458 |
| 2020 | $10,116 | $113,057 | $27,448 | $85,609 |
| 2019 | $10,444 | $114,804 | $27,448 | $87,356 |
| 2018 | $11,366 | $118,269 | $28,276 | $89,993 |
| 2017 | $11,509 | $118,269 | $28,276 | $89,993 |
| 2016 | $11,036 | $112,103 | $26,802 | $85,301 |
| 2015 | $11,104 | $107,791 | $25,771 | $82,020 |
| 2014 | -- | $101,689 | $24,312 | $77,377 |
| 2013 | -- | $101,689 | $24,312 | $77,377 |
Source: Public Records
Map
Nearby Homes
- 627 Henry Ln
- 846 Preston Ln
- 640 Henry Ln
- 442 Bower Ln
- 644 Henry Ln
- 646 Henry Ln
- 286 Willington Way
- 293 Willington Way
- 172 Piper Glen Ave
- 605 Henry Ln
- 714 Alberta Ave
- 715 Alberta Ave
- 530 Litchfield Way
- 526 Litchfield Way
- 100 Piper Glen Ave
- 100 Piper Glen Ave
- 100 Piper Glen Ave
- 100 Piper Glen Ave
- 100 Piper Glen Ave
- 100 Piper Glen Ave