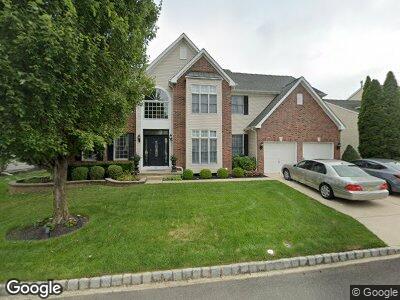
21 Greenbrier Dr Mount Holly, NJ 08060
Deerwood NeighborhoodEstimated Value: $675,418 - $751,000
--
Bed
--
Bath
3,440
Sq Ft
$207/Sq Ft
Est. Value
About This Home
This home is located at 21 Greenbrier Dr, Mount Holly, NJ 08060 and is currently estimated at $711,105, approximately $206 per square foot. 21 Greenbrier Dr is a home located in Burlington County with nearby schools including Holly Hills Elementary School, Westampton Township Middle School, and Rancocas Valley Regional High School.
Ownership History
Date
Name
Owned For
Owner Type
Purchase Details
Closed on
Oct 15, 2002
Sold by
Beazer Homes Corp
Bought by
Burns Alexander and Zak Burns Edyta
Current Estimated Value
Home Financials for this Owner
Home Financials are based on the most recent Mortgage that was taken out on this home.
Original Mortgage
$281,000
Interest Rate
6.09%
Create a Home Valuation Report for This Property
The Home Valuation Report is an in-depth analysis detailing your home's value as well as a comparison with similar homes in the area
Home Values in the Area
Average Home Value in this Area
Purchase History
| Date | Buyer | Sale Price | Title Company |
|---|---|---|---|
| Burns Alexander | $351,451 | Congress Title Corp | |
| -- | $351,500 | -- |
Source: Public Records
Mortgage History
| Date | Status | Borrower | Loan Amount |
|---|---|---|---|
| Open | Burns Alexander | $110,000 | |
| Open | Burns Alexander | $267,772 | |
| Closed | Burns Alexander | $45,000 | |
| Closed | Burns Alexander | $317,000 | |
| Closed | Burns Alexander | $36,000 | |
| Closed | -- | $281,000 |
Source: Public Records
Tax History Compared to Growth
Tax History
| Year | Tax Paid | Tax Assessment Tax Assessment Total Assessment is a certain percentage of the fair market value that is determined by local assessors to be the total taxable value of land and additions on the property. | Land | Improvement |
|---|---|---|---|---|
| 2024 | $11,339 | $419,500 | $64,000 | $355,500 |
| 2023 | $11,339 | $419,500 | $64,000 | $355,500 |
| 2022 | $10,773 | $419,500 | $64,000 | $355,500 |
| 2021 | $10,374 | $419,500 | $64,000 | $355,500 |
| 2020 | $10,332 | $419,500 | $64,000 | $355,500 |
| 2019 | $10,123 | $419,500 | $64,000 | $355,500 |
| 2018 | $9,992 | $419,500 | $64,000 | $355,500 |
| 2017 | $9,728 | $419,500 | $64,000 | $355,500 |
| 2016 | $9,548 | $419,500 | $64,000 | $355,500 |
| 2015 | $9,363 | $419,500 | $64,000 | $355,500 |
| 2014 | $9,124 | $419,500 | $64,000 | $355,500 |
Source: Public Records
Map
Nearby Homes