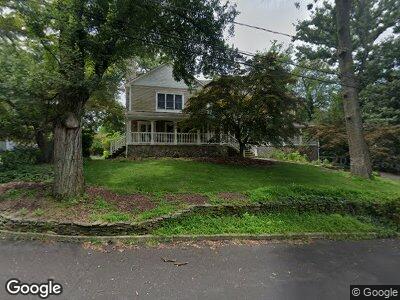
21 Lyons St Wyckoff, NJ 07481
Wyckoff NeighborhoodEstimated Value: $1,923,000 - $2,459,000
--
Bed
--
Bath
5,419
Sq Ft
$389/Sq Ft
Est. Value
About This Home
This home is located at 21 Lyons St, Wyckoff, NJ 07481 and is currently estimated at $2,107,293, approximately $388 per square foot. 21 Lyons St is a home located in Bergen County with nearby schools including Abraham Lincoln Elementary School, Dwight D Eisenhower Middle School, and Ramapo High School.
Ownership History
Date
Name
Owned For
Owner Type
Purchase Details
Closed on
Dec 6, 2005
Sold by
Tani Peter
Bought by
Blakeslee David and Blakeslee Dorothy
Current Estimated Value
Purchase Details
Closed on
Aug 30, 1996
Sold by
Estate Of Elizabeth Van Dyk
Bought by
Tani Peter J and Tani Patricia A
Home Financials for this Owner
Home Financials are based on the most recent Mortgage that was taken out on this home.
Original Mortgage
$162,000
Interest Rate
8.11%
Create a Home Valuation Report for This Property
The Home Valuation Report is an in-depth analysis detailing your home's value as well as a comparison with similar homes in the area
Home Values in the Area
Average Home Value in this Area
Purchase History
| Date | Buyer | Sale Price | Title Company |
|---|---|---|---|
| Blakeslee David | $1,360,000 | -- | |
| Tani Peter J | $190,000 | -- |
Source: Public Records
Mortgage History
| Date | Status | Borrower | Loan Amount |
|---|---|---|---|
| Previous Owner | Tani Patricia A | $600,000 | |
| Previous Owner | Tani Peter J | $162,000 |
Source: Public Records
Tax History Compared to Growth
Tax History
| Year | Tax Paid | Tax Assessment Tax Assessment Total Assessment is a certain percentage of the fair market value that is determined by local assessors to be the total taxable value of land and additions on the property. | Land | Improvement |
|---|---|---|---|---|
| 2024 | $28,492 | $1,505,100 | $509,700 | $995,400 |
| 2023 | $27,724 | $1,505,100 | $509,700 | $995,400 |
| 2022 | $27,724 | $1,505,100 | $509,700 | $995,400 |
| 2021 | $27,735 | $1,505,100 | $509,700 | $995,400 |
| 2020 | $27,619 | $1,505,100 | $509,700 | $995,400 |
| 2019 | $27,242 | $1,505,100 | $509,700 | $995,400 |
| 2018 | $26,821 | $1,505,100 | $509,700 | $995,400 |
| 2017 | $26,490 | $1,505,100 | $509,700 | $995,400 |
| 2016 | $26,068 | $1,505,100 | $509,700 | $995,400 |
| 2015 | $25,782 | $1,505,100 | $509,700 | $995,400 |
| 2014 | $21,326 | $1,343,800 | $509,700 | $834,100 |
Source: Public Records
Map
Nearby Homes