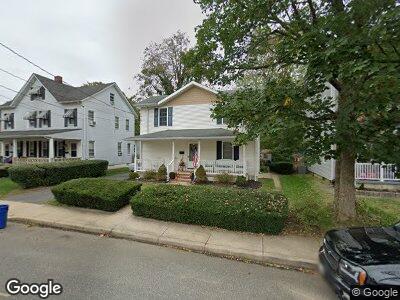
21 Morrell St Long Branch, NJ 07740
Estimated Value: $502,000 - $605,000
2
Beds
2
Baths
1,456
Sq Ft
$376/Sq Ft
Est. Value
About This Home
This home is located at 21 Morrell St, Long Branch, NJ 07740 and is currently estimated at $547,831, approximately $376 per square foot. 21 Morrell St is a home located in Monmouth County with nearby schools including Long Branch High School and Holy Trinity School.
Ownership History
Date
Name
Owned For
Owner Type
Purchase Details
Closed on
Jan 10, 2011
Sold by
Woolley Jodi L
Bought by
Diaz Jose A and Diaz Judith M
Current Estimated Value
Home Financials for this Owner
Home Financials are based on the most recent Mortgage that was taken out on this home.
Original Mortgage
$199,803
Interest Rate
4.83%
Mortgage Type
FHA
Create a Home Valuation Report for This Property
The Home Valuation Report is an in-depth analysis detailing your home's value as well as a comparison with similar homes in the area
Home Values in the Area
Average Home Value in this Area
Purchase History
| Date | Buyer | Sale Price | Title Company |
|---|---|---|---|
| Diaz Jose A | $205,000 | Fidelity Natl Title Ins Co |
Source: Public Records
Mortgage History
| Date | Status | Borrower | Loan Amount |
|---|---|---|---|
| Open | Diaz Jose A | $234,838 | |
| Closed | Diaz Jose A | $235,388 | |
| Closed | Diaz Jose A | $238,705 | |
| Closed | Diaz Jose | $221,408 | |
| Closed | Diaz Jose A | $188,720 | |
| Closed | Diaz Jose A | $199,174 | |
| Closed | Diaz Jose A | $199,549 | |
| Closed | Diaz Jose A | $199,803 |
Source: Public Records
Tax History Compared to Growth
Tax History
| Year | Tax Paid | Tax Assessment Tax Assessment Total Assessment is a certain percentage of the fair market value that is determined by local assessors to be the total taxable value of land and additions on the property. | Land | Improvement |
|---|---|---|---|---|
| 2024 | $6,583 | $485,600 | $228,400 | $257,200 |
| 2023 | $6,583 | $423,900 | $178,400 | $245,500 |
| 2022 | $6,053 | $336,600 | $120,300 | $216,300 |
| 2021 | $6,053 | $302,500 | $100,300 | $202,200 |
| 2020 | $6,069 | $290,400 | $89,300 | $201,100 |
| 2019 | $5,928 | $282,000 | $90,300 | $191,700 |
| 2018 | $5,814 | $275,000 | $90,300 | $184,700 |
| 2017 | $5,596 | $271,500 | $90,300 | $181,200 |
| 2016 | $5,493 | $271,800 | $95,300 | $176,500 |
| 2015 | $5,463 | $245,300 | $97,900 | $147,400 |
| 2014 | $5,082 | $240,500 | $109,700 | $130,800 |
Source: Public Records
Map
Nearby Homes
- 441 Division St
- 479 Hampton Ave
- 485 Hampton Ave
- 42 Dudley St
- 28 Norwood Ave
- 421 Westbourne Ave
- 399 Broadway
- 105 Norwood Ave
- 537 Winter St
- 317 Morris Ave
- 15 Jackson St
- 546 Winter St
- 31 Howland Place
- 338 Wharburton Place
- 628 Irving Place
- 682 Art St
- 619 Irving Place
- 364 Westwood Ave Unit 50
- 364 Westwood Ave Unit 91
- 364 Westwood Ave Unit 23