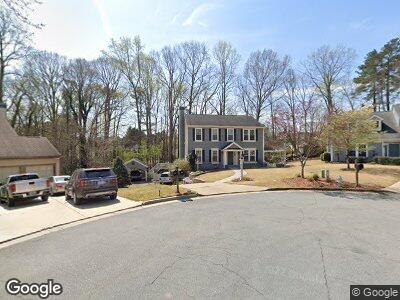
210 Douglas Fir Ct Unit 1 Alpharetta, GA 30022
Ocee NeighborhoodEstimated Value: $500,655 - $564,000
3
Beds
3
Baths
2,160
Sq Ft
$242/Sq Ft
Est. Value
About This Home
This home is located at 210 Douglas Fir Ct Unit 1, Alpharetta, GA 30022 and is currently estimated at $521,914, approximately $241 per square foot. 210 Douglas Fir Ct Unit 1 is a home located in Fulton County with nearby schools including Abbotts Hill Elementary School, Taylor Road Middle School, and Chattahoochee High School.
Ownership History
Date
Name
Owned For
Owner Type
Purchase Details
Closed on
Nov 18, 2021
Sold by
Smith Norman R
Bought by
Liv Norman and Liv Janine
Current Estimated Value
Purchase Details
Closed on
Jan 2, 1998
Sold by
Kennedy Michael B and Kennedy Laura M
Bought by
Smith Norman R and Smith Janine M
Home Financials for this Owner
Home Financials are based on the most recent Mortgage that was taken out on this home.
Original Mortgage
$133,050
Interest Rate
7.18%
Mortgage Type
FHA
Purchase Details
Closed on
Nov 20, 1995
Sold by
Toll William Saundra L
Bought by
Kennedy Michael B Laura M
Create a Home Valuation Report for This Property
The Home Valuation Report is an in-depth analysis detailing your home's value as well as a comparison with similar homes in the area
Home Values in the Area
Average Home Value in this Area
Purchase History
| Date | Buyer | Sale Price | Title Company |
|---|---|---|---|
| Liv Norman | -- | -- | |
| Smith Norman R | $144,500 | -- | |
| Kennedy Michael B Laura M | $38,000 | -- |
Source: Public Records
Mortgage History
| Date | Status | Borrower | Loan Amount |
|---|---|---|---|
| Previous Owner | Smith Norman R | $150,000 | |
| Previous Owner | Smith Norman R | $173,000 | |
| Previous Owner | Smith Norman R | $192,000 | |
| Previous Owner | Smith Norman R | $188,000 | |
| Previous Owner | Smith Norman R | $12,000 | |
| Previous Owner | Smith Norman R | $202,400 | |
| Previous Owner | Smith Janine M | $168,000 | |
| Previous Owner | Smith Norman R | $21,485 | |
| Previous Owner | Smith Norman R | $133,050 | |
| Closed | Kennedy Michael B Laura M | $0 |
Source: Public Records
Tax History Compared to Growth
Tax History
| Year | Tax Paid | Tax Assessment Tax Assessment Total Assessment is a certain percentage of the fair market value that is determined by local assessors to be the total taxable value of land and additions on the property. | Land | Improvement |
|---|---|---|---|---|
| 2023 | $4,592 | $162,680 | $34,400 | $128,280 |
| 2022 | $3,764 | $162,680 | $34,400 | $128,280 |
| 2021 | $2,740 | $134,400 | $26,720 | $107,680 |
| 2020 | $2,757 | $132,800 | $26,400 | $106,400 |
| 2019 | $326 | $111,960 | $19,680 | $92,280 |
| 2018 | $3,016 | $109,320 | $19,200 | $90,120 |
| 2017 | $2,668 | $90,560 | $18,160 | $72,400 |
| 2016 | $2,616 | $90,560 | $18,160 | $72,400 |
| 2015 | $2,586 | $88,680 | $18,160 | $70,520 |
| 2014 | $2,261 | $77,160 | $17,480 | $59,680 |
Source: Public Records
Map
Nearby Homes
- 290 Pine Bridge Trail
- 5011 Weathervane Dr
- 4960 Cinnabar Dr
- 4560 Weathervane Dr
- 335 Aqueduct Ct
- 200 Boca Ciega Ct
- 11370 Ridge Hill Dr Unit 3
- 4845 Weathervane Dr
- 11250 Bramshill Dr
- 11140 Brookhollow Trail
- 140 Boxford Ct
- 160 Brookhollow Trace
- 11165 Bentley Chase Dr
- 11570 Dunhill Place Dr
- 10855 Bossier Dr
- 11050 Linbrook Ln Unit II
- 115 Westbury Ln