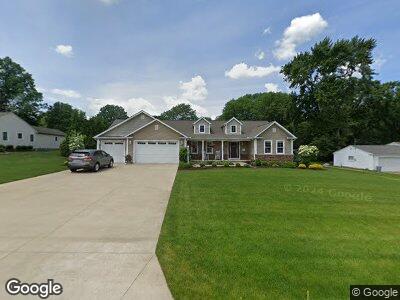
210 Northview Rd Canfield, OH 44406
Estimated Value: $264,000 - $418,547
3
Beds
3
Baths
1,956
Sq Ft
$175/Sq Ft
Est. Value
About This Home
This home is located at 210 Northview Rd, Canfield, OH 44406 and is currently estimated at $343,137, approximately $175 per square foot. 210 Northview Rd is a home located in Mahoning County with nearby schools including Canfield Village Middle School and Canfield High School.
Ownership History
Date
Name
Owned For
Owner Type
Purchase Details
Closed on
Feb 29, 2016
Sold by
Brownstone Construction Llc
Bought by
Sevenich Eric D and Sevenich Jennifer J
Current Estimated Value
Home Financials for this Owner
Home Financials are based on the most recent Mortgage that was taken out on this home.
Original Mortgage
$276,000
Interest Rate
3.92%
Mortgage Type
New Conventional
Purchase Details
Closed on
Oct 9, 2013
Sold by
Hoover Eric
Bought by
Brownstone Construction Llc
Purchase Details
Closed on
May 9, 2006
Sold by
Not Provided
Bought by
Hoover Eric and Hoover Stephanie A
Home Financials for this Owner
Home Financials are based on the most recent Mortgage that was taken out on this home.
Original Mortgage
$161,500
Interest Rate
6.62%
Mortgage Type
Purchase Money Mortgage
Purchase Details
Closed on
Jun 14, 1974
Bought by
Brown George T and Brown Agnes C
Create a Home Valuation Report for This Property
The Home Valuation Report is an in-depth analysis detailing your home's value as well as a comparison with similar homes in the area
Home Values in the Area
Average Home Value in this Area
Purchase History
| Date | Buyer | Sale Price | Title Company |
|---|---|---|---|
| Sevenich Eric D | $367,800 | Attorney | |
| Brownstone Construction Llc | $20,350 | None Available | |
| Hoover Eric | $170,000 | None Available | |
| Brown George T | -- | -- |
Source: Public Records
Mortgage History
| Date | Status | Borrower | Loan Amount |
|---|---|---|---|
| Open | Sevenich Eric D | $240,000 | |
| Closed | Sevenich Eric D | $276,000 | |
| Previous Owner | Hoover Eric | $161,500 | |
| Previous Owner | Brown George | $24,000 | |
| Previous Owner | Brown George T | $136,000 |
Source: Public Records
Tax History Compared to Growth
Tax History
| Year | Tax Paid | Tax Assessment Tax Assessment Total Assessment is a certain percentage of the fair market value that is determined by local assessors to be the total taxable value of land and additions on the property. | Land | Improvement |
|---|---|---|---|---|
| 2024 | $5,522 | $128,160 | $16,140 | $112,020 |
| 2023 | $5,435 | $128,160 | $16,140 | $112,020 |
| 2022 | $4,588 | $86,080 | $14,310 | $71,770 |
| 2021 | $4,453 | $86,080 | $14,310 | $71,770 |
| 2020 | $4,471 | $86,080 | $14,310 | $71,770 |
| 2019 | $4,518 | $78,970 | $13,130 | $65,840 |
| 2018 | $4,462 | $78,970 | $13,130 | $65,840 |
| 2017 | $4,459 | $78,970 | $13,130 | $65,840 |
| 2016 | $4,124 | $72,720 | $11,530 | $61,190 |
| 2015 | $576 | $10,380 | $10,380 | $0 |
| 2014 | $578 | $10,380 | $10,380 | $0 |
| 2013 | $558 | $10,380 | $10,380 | $0 |
Source: Public Records
Map
Nearby Homes
- 174 N Broad St
- 281 Bradford Dr
- 201 W Main St
- 267 W Main St
- 355 Sleepy Hollow Dr
- 63 Skyline Dr
- 90 Villa Theresa Ln
- 70 Villa Theresa Ln
- 31 Villa Theresa Ln
- 21 Villa Theresa Ln
- 202 E Main St
- 30 Villa Theresa Ln
- 10 Villa Theresa Ln
- 20 Villa Theresa Ln
- 251 Chapel Ln
- 184 Hilltop Blvd
- 60 Barnstone Ln
- 491 Millbrook St
- 280 Russo Dr
- 504 Shadydale Dr Unit 504