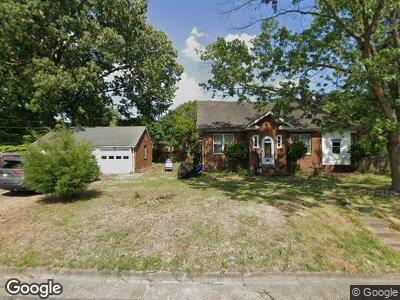
210 Raleigh Ave Hampton, VA 23661
Wythe NeighborhoodEstimated Value: $315,000 - $355,681
4
Beds
2
Baths
2,340
Sq Ft
$142/Sq Ft
Est. Value
About This Home
This home is located at 210 Raleigh Ave, Hampton, VA 23661 and is currently estimated at $331,420, approximately $141 per square foot. 210 Raleigh Ave is a home located in Hampton City with nearby schools including Hunter B. Andrews PK-8 School, C. Alton Lindsay Middle School, and Hampton High School.
Ownership History
Date
Name
Owned For
Owner Type
Purchase Details
Closed on
Aug 25, 2022
Sold by
Anthony Warner Stephen and Anthony Carey
Bought by
Oquendo Steven
Current Estimated Value
Home Financials for this Owner
Home Financials are based on the most recent Mortgage that was taken out on this home.
Original Mortgage
$281,792
Outstanding Balance
$271,908
Interest Rate
5.3%
Mortgage Type
VA
Estimated Equity
$59,512
Purchase Details
Closed on
Jul 21, 2008
Sold by
Bengtson Diane Nielsen
Bought by
Warner Stephen A
Home Financials for this Owner
Home Financials are based on the most recent Mortgage that was taken out on this home.
Original Mortgage
$207,774
Interest Rate
6.47%
Mortgage Type
FHA
Purchase Details
Closed on
Jun 24, 2005
Sold by
Boyer Kenneth E
Bought by
Nielsen Diane E
Home Financials for this Owner
Home Financials are based on the most recent Mortgage that was taken out on this home.
Original Mortgage
$193,471
Interest Rate
5.66%
Mortgage Type
FHA
Create a Home Valuation Report for This Property
The Home Valuation Report is an in-depth analysis detailing your home's value as well as a comparison with similar homes in the area
Home Values in the Area
Average Home Value in this Area
Purchase History
| Date | Buyer | Sale Price | Title Company |
|---|---|---|---|
| Oquendo Steven | $272,000 | Peninsula Title | |
| Warner Stephen A | $210,000 | -- | |
| Nielsen Diane E | $195,000 | -- |
Source: Public Records
Mortgage History
| Date | Status | Borrower | Loan Amount |
|---|---|---|---|
| Open | Oquendo Steven | $281,792 | |
| Previous Owner | Warner Stephen Anthony | $188,708 | |
| Previous Owner | Warner Stephen A | $195,378 | |
| Previous Owner | Warner Stephen A | $207,774 | |
| Previous Owner | Nielsen Diane E | $193,471 |
Source: Public Records
Tax History Compared to Growth
Tax History
| Year | Tax Paid | Tax Assessment Tax Assessment Total Assessment is a certain percentage of the fair market value that is determined by local assessors to be the total taxable value of land and additions on the property. | Land | Improvement |
|---|---|---|---|---|
| 2024 | $3,289 | $286,000 | $73,600 | $212,400 |
| 2023 | $3,202 | $276,000 | $71,300 | $204,700 |
| 2022 | $3,093 | $262,100 | $66,700 | $195,400 |
| 2021 | $2,931 | $225,900 | $57,500 | $168,400 |
| 2020 | $2,766 | $223,100 | $55,200 | $167,900 |
| 2019 | $2,752 | $221,900 | $55,200 | $166,700 |
| 2018 | $2,775 | $216,200 | $81,200 | $135,000 |
| 2017 | $2,775 | $0 | $0 | $0 |
| 2016 | $2,775 | $216,200 | $0 | $0 |
| 2015 | $2,775 | $0 | $0 | $0 |
| 2014 | $2,765 | $216,200 | $81,200 | $135,000 |
Source: Public Records
Map
Nearby Homes
- 224 Little Farms Ave
- 135 Hampton Roads Ave
- 216 Manteo Ave
- 237 Pochin Place
- 325 Hampton Roads Ave
- 117 Pochin Place
- 89 Alleghany Rd
- 146 Shenandoah Rd
- 409 Glendale Rd
- 2519 Laguard Dr
- 2601 Shell Rd
- 628 Celey St
- 2513 Shell Rd
- 619 Teach St
- 406 Colonial Ave
- 167 Cherokee Rd
- 341 Algonquin Rd
- 432 Glendale Rd
- 2731 Jamestown Ave
- 2711 Shell Rd