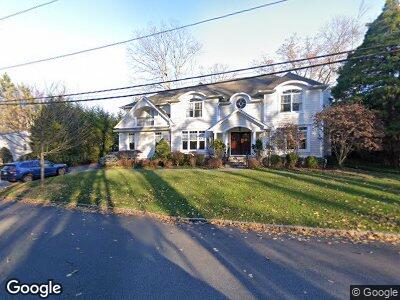
211 Whitman St Haworth, NJ 07641
Haworth NeighborhoodEstimated Value: $1,749,000 - $2,256,000
--
Bed
--
Bath
3,865
Sq Ft
$488/Sq Ft
Est. Value
About This Home
This home is located at 211 Whitman St, Haworth, NJ 07641 and is currently estimated at $1,888,040, approximately $488 per square foot. 211 Whitman St is a home located in Bergen County with nearby schools including Haworth Elementary School, Northern Valley Regional High School at Demarest, and Acton Academy of Bergen County.
Ownership History
Date
Name
Owned For
Owner Type
Purchase Details
Closed on
Jun 23, 2016
Sold by
Donnelly John and Donnelly Natalie
Bought by
Kontorovich Alexander and Kontorovich Amy
Current Estimated Value
Home Financials for this Owner
Home Financials are based on the most recent Mortgage that was taken out on this home.
Original Mortgage
$1,137,000
Interest Rate
3.48%
Mortgage Type
New Conventional
Purchase Details
Closed on
Aug 2, 2007
Sold by
Demarest Builders Llc
Bought by
Donnelly John
Home Financials for this Owner
Home Financials are based on the most recent Mortgage that was taken out on this home.
Original Mortgage
$470,000
Interest Rate
6.74%
Mortgage Type
New Conventional
Purchase Details
Closed on
Nov 17, 2005
Sold by
John Finan Builders Inc
Bought by
Demarest Builders Llc
Purchase Details
Closed on
Jul 18, 2005
Sold by
Jakobsen Cathleen
Bought by
John Finan Builders Inc
Purchase Details
Closed on
Dec 20, 2004
Sold by
Foster Guy
Bought by
Jakobsen Cathleen
Create a Home Valuation Report for This Property
The Home Valuation Report is an in-depth analysis detailing your home's value as well as a comparison with similar homes in the area
Home Values in the Area
Average Home Value in this Area
Purchase History
| Date | Buyer | Sale Price | Title Company |
|---|---|---|---|
| Kontorovich Alexander | $1,427,500 | Attorney | |
| Donnelly John | $1,470,000 | -- | |
| Demarest Builders Llc | $650,000 | -- | |
| John Finan Builders Inc | $575,000 | -- | |
| Jakobsen Cathleen | $550,000 | -- |
Source: Public Records
Mortgage History
| Date | Status | Borrower | Loan Amount |
|---|---|---|---|
| Previous Owner | Kontorovich Alexander | $1,137,000 | |
| Previous Owner | Donnelly John | $470,000 |
Source: Public Records
Tax History Compared to Growth
Tax History
| Year | Tax Paid | Tax Assessment Tax Assessment Total Assessment is a certain percentage of the fair market value that is determined by local assessors to be the total taxable value of land and additions on the property. | Land | Improvement |
|---|---|---|---|---|
| 2024 | $29,617 | $973,600 | $257,000 | $716,600 |
| 2023 | $29,004 | $973,600 | $257,000 | $716,600 |
| 2022 | $29,004 | $973,600 | $257,000 | $716,600 |
| 2021 | $28,663 | $973,600 | $257,000 | $716,600 |
| 2020 | $28,419 | $973,600 | $257,000 | $716,600 |
| 2019 | $28,342 | $973,600 | $257,000 | $716,600 |
| 2018 | $27,913 | $973,600 | $257,000 | $716,600 |
| 2017 | $28,069 | $973,600 | $257,000 | $716,600 |
| 2016 | $28,332 | $973,600 | $257,000 | $716,600 |
| 2015 | $27,212 | $973,600 | $257,000 | $716,600 |
| 2014 | $26,793 | $973,600 | $257,000 | $716,600 |
Source: Public Records
Map
Nearby Homes
- 226 Pine St
- 308 Garfield St
- 88 Woodland Rd
- 49 Knickerbocker Rd
- 30 Hardenburgh Ave
- 45 Lenox Ave
- 110 Mason Ct Unit 3E
- 166 Delong Ave
- 14 Laurel Rd
- 628 Knickerbocker Rd
- 56 Mountain View Rd
- 38 Harding Ave
- 351 Durie Ave
- 217 Maple St
- 253 Maple St
- 9 Heatherhill Rd
- 16 Achilles St
- 115 Maple St
- 15 Laurel Ave
- 108 Serpentine Rd