
Seller's Agent in 2024
kelly Pessis
Compass
(310) 980-5373
16 Total Sales
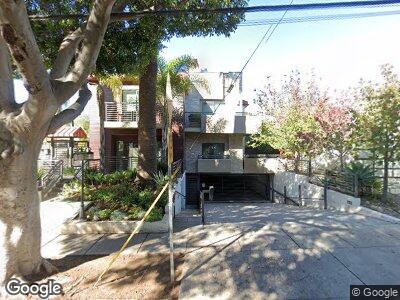
APPLICATION IN PROCESS. Beautiful 2010 Townhouse, 2+2.5 + flex/office space+ 2-car garage+bonus loft. Over 1800sf in one of the most sought after buildings, with private, side by side, 2-car attached garage! Clean contemporary lines and finishes, plus great design, make this the gem you have been holding out for. This home boasts a private main floor patio, plus a large private rooftop deck w/panoramic views by day, & dramatic city lights by night. The open concept first floor plan has great indoor outdoor flow and there are high ceilings and lots of windows all around. The unit borders single story single family homes to the east, for maximum privacy. The primary bedroom has an en suite bath, and the "bonus area" upstairs is approx. 124sf and perfect for a reading or meditation nook, gaming space or TV room. The garage level has an approx. 178 sf room with entry separate from the main living area making it perfect for a home office or studio, plus laundry and room for additional storage for bikes, boards & all of your beach gear. Quartz counters, stainless appliances, sleek, high-end finishes and a great layering of modern with warm textures throughout. Direct entry from your own garage into to your private oasis. Great pedestrian and bike friendly area with Whole Foods, Metro, dining, beach, SMC, and more, just blocks away. Public records shows 3 bedroom, but it is 2bedroom. Two zone A/c and heat, gated and the building has additional gated covered guest parking. Directly adjacent to a park and library, pedestrian and public transit friendly. Located near the Edison Language Academy, The Water Garden business district, Whole Foods, and, of course, a bike ride away from beaches, 3rd street promenade, Pier, and hundreds of eateries and shops. Pets considered, monthly fee + additional insurance, sorry, but some breeds are excluded for insurance coverage. Credit and references checked, see attached document for guidelines * Assessor records shows unit as 3 bedroom, but it is 2+ garage level bonus of approx + upper loft area that measures an additional 124sf.
| Date | Buyer | Sale Price | Title Company |
|---|---|---|---|
| Zaw Tin | -- | Title 365 | |
| Zaw Tin | $710,000 | Chicago Title |
| Date | Status | Borrower | Loan Amount |
|---|---|---|---|
| Open | Lee Wendy | $150,000 | |
| Open | Zaw Tin | $475,688 | |
| Closed | Zaw Tin | $530,000 | |
| Previous Owner | Zaw Tin | $532,500 |
| Date | Event | Price | Change | Sq Ft Price |
|---|---|---|---|---|
| 11/29/2024 11/29/24 | Rented | $6,495 | 0.0% | -- |
| 11/19/2024 11/19/24 | Under Contract | -- | -- | -- |
| 11/08/2024 11/08/24 | For Rent | $6,495 | 0.0% | -- |
| 11/03/2024 11/03/24 | Off Market | $6,495 | -- | -- |
| 10/10/2024 10/10/24 | For Rent | $6,995 | +6.0% | -- |
| 08/08/2023 08/08/23 | Rented | $6,600 | +1.5% | -- |
| 08/08/2023 08/08/23 | For Rent | $6,500 | 0.0% | -- |
| 08/07/2023 08/07/23 | Under Contract | -- | -- | -- |
| 08/02/2023 08/02/23 | Off Market | $6,500 | -- | -- |
| 07/28/2023 07/28/23 | For Rent | $6,500 | -- | -- |
| Year | Tax Paid | Tax Assessment Tax Assessment Total Assessment is a certain percentage of the fair market value that is determined by local assessors to be the total taxable value of land and additions on the property. | Land | Improvement |
|---|---|---|---|---|
| 2024 | $11,105 | $898,502 | $545,431 | $353,071 |
| 2023 | $10,925 | $880,886 | $534,737 | $346,149 |
| 2022 | $10,780 | $863,614 | $524,252 | $339,362 |
| 2021 | $10,499 | $846,681 | $513,973 | $332,708 |
| 2019 | $10,317 | $821,570 | $498,729 | $322,841 |
| 2018 | $9,709 | $805,461 | $488,950 | $316,511 |
| 2016 | $9,339 | $774,185 | $469,964 | $304,221 |
| 2015 | $9,216 | $762,557 | $462,905 | $299,652 |
| 2014 | $9,091 | $747,621 | $453,838 | $293,783 |
Seller's Agent in 2024
kelly Pessis
Compass
(310) 980-5373
16 Total Sales
Buyer's Agent in 2023
Rachel Tabak
Keller Williams North Valley
(818) 657-6500
7 Total Sales