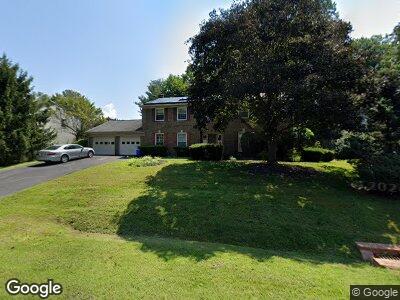
2123 Falling Creek Rd Silver Spring, MD 20904
Fairland NeighborhoodEstimated Value: $711,969 - $806,000
--
Bed
4
Baths
2,800
Sq Ft
$272/Sq Ft
Est. Value
About This Home
This home is located at 2123 Falling Creek Rd, Silver Spring, MD 20904 and is currently estimated at $761,992, approximately $272 per square foot. 2123 Falling Creek Rd is a home located in Montgomery County with nearby schools including William Tyler Page Elementary School, Briggs Chaney Middle School, and James Hubert Blake High School.
Ownership History
Date
Name
Owned For
Owner Type
Purchase Details
Closed on
May 7, 2021
Sold by
Mallory Lloyd M
Bought by
Mallory Lloyd M and Mallory Lloyd M
Current Estimated Value
Purchase Details
Closed on
Jun 22, 2020
Sold by
Mallory Lloyd M and Mallory Lloyd M
Bought by
Mallory Lloyd M
Home Financials for this Owner
Home Financials are based on the most recent Mortgage that was taken out on this home.
Original Mortgage
$549,283
Outstanding Balance
$494,179
Interest Rate
3.1%
Mortgage Type
VA
Estimated Equity
$252,936
Purchase Details
Closed on
Feb 26, 2020
Sold by
Mallory Lloyd M
Bought by
Mallory Lloyd M and Mallory Sr Rlt Lloyd M
Purchase Details
Closed on
Aug 18, 2010
Sold by
Mallory Lloyd M and Mallory Billye B
Bought by
Mallory Lloyd M
Purchase Details
Closed on
Aug 11, 2003
Sold by
Mallory Lloyd M Et Al Tr
Bought by
Mallory Lloyd M
Purchase Details
Closed on
Feb 11, 1998
Sold by
B Lloyd M and B Mallory B
Bought by
Lloyd M Mallory Et Al Tr
Create a Home Valuation Report for This Property
The Home Valuation Report is an in-depth analysis detailing your home's value as well as a comparison with similar homes in the area
Home Values in the Area
Average Home Value in this Area
Purchase History
| Date | Buyer | Sale Price | Title Company |
|---|---|---|---|
| Mallory Lloyd M | -- | Resource Re Svcs Llc | |
| Mallory Lloyd M | -- | Resource Re Svcs Llc | |
| Mallory Lloyd M | -- | None Available | |
| Mallory Lloyd M | -- | -- | |
| Mallory Lloyd M | -- | -- | |
| Lloyd M Mallory Et Al Tr | -- | -- |
Source: Public Records
Mortgage History
| Date | Status | Borrower | Loan Amount |
|---|---|---|---|
| Open | Mallory Lloyd M | $549,283 | |
| Closed | Mallory Lloyd M | $538,953 | |
| Closed | Mallory Lloyd M | $535,094 | |
| Closed | Mallory Lloyd M | $330,078 | |
| Closed | Mallory Lloyd Mack | $315,847 | |
| Previous Owner | Mallory Lloyd M | $125,000 |
Source: Public Records
Tax History Compared to Growth
Tax History
| Year | Tax Paid | Tax Assessment Tax Assessment Total Assessment is a certain percentage of the fair market value that is determined by local assessors to be the total taxable value of land and additions on the property. | Land | Improvement |
|---|---|---|---|---|
| 2024 | $7,475 | $596,600 | $0 | $0 |
| 2023 | $6,259 | $553,000 | $233,400 | $319,600 |
| 2022 | $5,603 | $522,033 | $0 | $0 |
| 2021 | $4,821 | $491,067 | $0 | $0 |
| 2020 | $4,821 | $460,100 | $233,400 | $226,700 |
| 2019 | $4,794 | $460,100 | $233,400 | $226,700 |
| 2018 | $4,777 | $460,100 | $233,400 | $226,700 |
| 2017 | $4,911 | $464,400 | $0 | $0 |
| 2016 | $5,735 | $459,333 | $0 | $0 |
| 2015 | $5,735 | $454,267 | $0 | $0 |
| 2014 | $5,735 | $449,200 | $0 | $0 |
Source: Public Records
Map
Nearby Homes
- 9 Falling Creek Ct
- 13423 Fairland Park Dr
- 12704 Ruxton Rd
- 1802 Tufa Terrace
- 0 Fairland Rd Unit MDMC2164644
- 0 Fairland Rd Unit MDMC2164640
- 12901 Summer Hill Dr
- 13425 Tamarack Rd
- 13039 Brahms Terrace
- 2614 Hershfield Ct
- 1415 Smith Village Rd
- 2863 Strauss Terrace
- 13410 Tamarack Rd
- 2705 Martello Dr
- 1319 Smith Village Rd
- 2702 Martello Dr
- 13220 Schubert Place
- 2900 Gracefield Rd
- 3012 Marlow Rd
- 14105 Sturtevant Rd